Mexican vs Cambodian Female Poverty Among 18-24 Year Olds
COMPARE
Mexican
Cambodian
Female Poverty Among 18-24 Year Olds
Female Poverty Among 18-24 Year Olds Comparison
Mexicans
Cambodians
20.5%
FEMALE POVERTY AMONG 18-24 YEAR OLDS
18.3/ 100
METRIC RATING
201st/ 347
METRIC RANK
19.4%
FEMALE POVERTY AMONG 18-24 YEAR OLDS
94.6/ 100
METRIC RATING
122nd/ 347
METRIC RANK
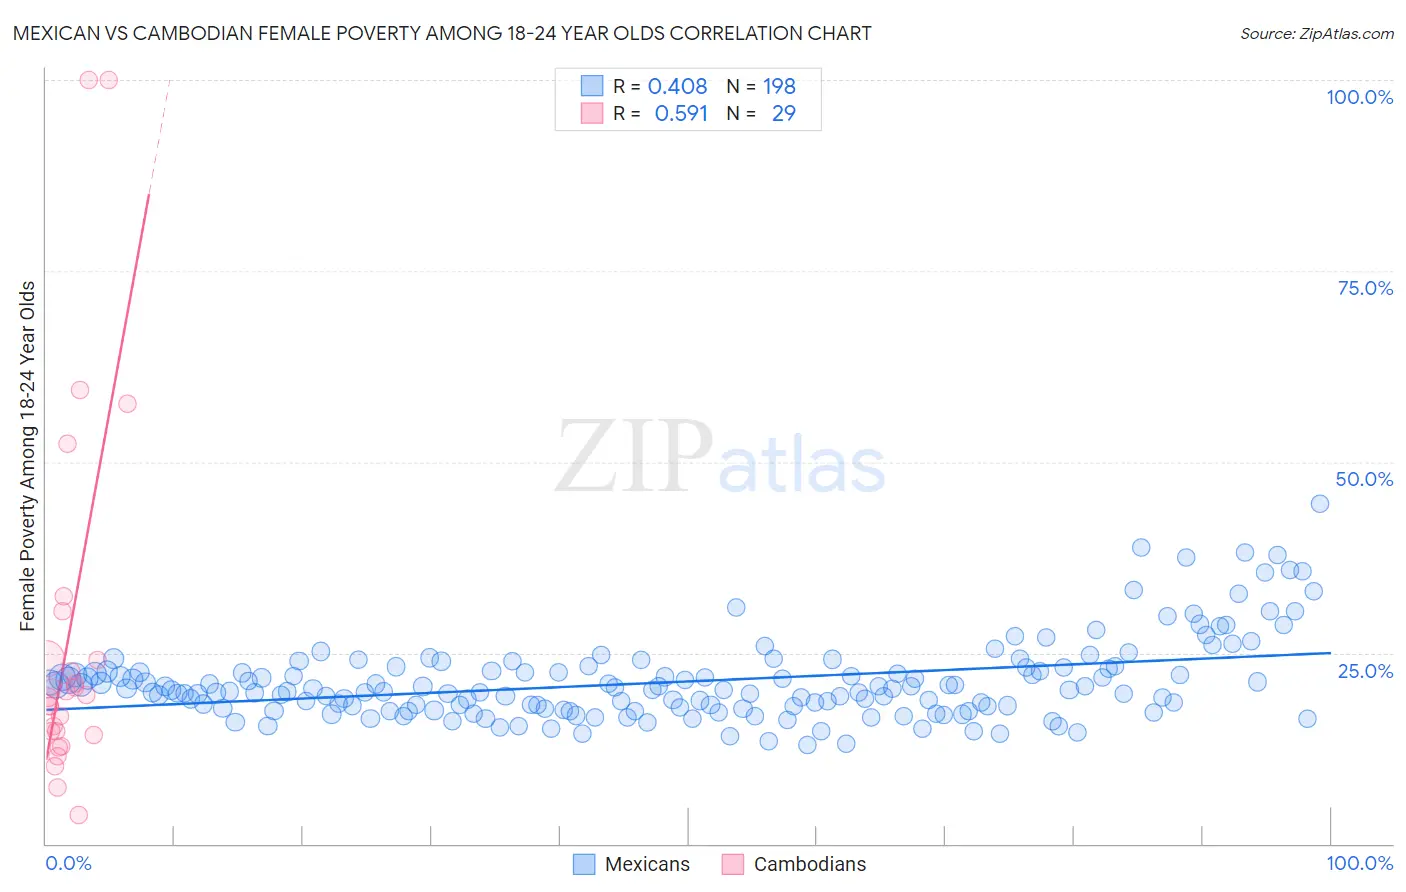
Mexican vs Cambodian Female Poverty Among 18-24 Year Olds Correlation Chart
The statistical analysis conducted on geographies consisting of 535,224,564 people shows a moderate positive correlation between the proportion of Mexicans and poverty level among females between the ages 18 and 24 in the United States with a correlation coefficient (R) of 0.408 and weighted average of 20.5%. Similarly, the statistical analysis conducted on geographies consisting of 101,940,154 people shows a substantial positive correlation between the proportion of Cambodians and poverty level among females between the ages 18 and 24 in the United States with a correlation coefficient (R) of 0.591 and weighted average of 19.4%, a difference of 5.5%.
Female Poverty Among 18-24 Year Olds Correlation Summary
| Measurement | Mexican | Cambodian |
| Minimum | 12.9% | 3.8% |
| Maximum | 44.4% | 100.0% |
| Range | 31.6% | 96.2% |
| Mean | 21.2% | 27.4% |
| Median | 20.1% | 19.4% |
| Interquartile 25% (IQ1) | 17.8% | 14.5% |
| Interquartile 75% (IQ3) | 22.6% | 27.4% |
| Interquartile Range (IQR) | 4.7% | 12.8% |
| Standard Deviation (Sample) | 5.2% | 24.2% |
| Standard Deviation (Population) | 5.2% | 23.8% |
Similar Demographics by Female Poverty Among 18-24 Year Olds
Demographics Similar to Mexicans by Female Poverty Among 18-24 Year Olds
In terms of female poverty among 18-24 year olds, the demographic groups most similar to Mexicans are Immigrants from Turkey (20.5%, a difference of 0.050%), Immigrants from Malaysia (20.5%, a difference of 0.090%), Immigrants from Netherlands (20.5%, a difference of 0.11%), European (20.4%, a difference of 0.13%), and English (20.5%, a difference of 0.13%).
| Demographics | Rating | Rank | Female Poverty Among 18-24 Year Olds |
| Mexican American Indians | 23.2 /100 | #194 | Fair 20.4% |
| Immigrants | Latvia | 23.0 /100 | #195 | Fair 20.4% |
| Czechs | 22.3 /100 | #196 | Fair 20.4% |
| Zimbabweans | 21.0 /100 | #197 | Fair 20.4% |
| Immigrants | Spain | 20.7 /100 | #198 | Fair 20.4% |
| Germans | 20.6 /100 | #199 | Fair 20.4% |
| Europeans | 19.9 /100 | #200 | Poor 20.4% |
| Mexicans | 18.3 /100 | #201 | Poor 20.5% |
| Immigrants | Turkey | 17.7 /100 | #202 | Poor 20.5% |
| Immigrants | Malaysia | 17.2 /100 | #203 | Poor 20.5% |
| Immigrants | Netherlands | 17.0 /100 | #204 | Poor 20.5% |
| English | 16.7 /100 | #205 | Poor 20.5% |
| Hispanics or Latinos | 16.6 /100 | #206 | Poor 20.5% |
| Spaniards | 16.3 /100 | #207 | Poor 20.5% |
| Dutch | 15.9 /100 | #208 | Poor 20.5% |
Demographics Similar to Cambodians by Female Poverty Among 18-24 Year Olds
In terms of female poverty among 18-24 year olds, the demographic groups most similar to Cambodians are Paraguayan (19.4%, a difference of 0.010%), Immigrants from Chile (19.4%, a difference of 0.070%), Immigrants from Panama (19.4%, a difference of 0.14%), Guyanese (19.4%, a difference of 0.19%), and Immigrants from Russia (19.4%, a difference of 0.20%).
| Demographics | Rating | Rank | Female Poverty Among 18-24 Year Olds |
| Immigrants | Hungary | 96.2 /100 | #115 | Exceptional 19.3% |
| Immigrants | Immigrants | 95.9 /100 | #116 | Exceptional 19.3% |
| Immigrants | Iran | 95.8 /100 | #117 | Exceptional 19.3% |
| Immigrants | Guyana | 95.6 /100 | #118 | Exceptional 19.3% |
| Cypriots | 95.5 /100 | #119 | Exceptional 19.3% |
| Immigrants | Northern Europe | 95.4 /100 | #120 | Exceptional 19.4% |
| Guyanese | 95.3 /100 | #121 | Exceptional 19.4% |
| Cambodians | 94.6 /100 | #122 | Exceptional 19.4% |
| Paraguayans | 94.6 /100 | #123 | Exceptional 19.4% |
| Immigrants | Chile | 94.3 /100 | #124 | Exceptional 19.4% |
| Immigrants | Panama | 94.0 /100 | #125 | Exceptional 19.4% |
| Immigrants | Russia | 93.7 /100 | #126 | Exceptional 19.4% |
| Cape Verdeans | 93.6 /100 | #127 | Exceptional 19.4% |
| Slovaks | 92.9 /100 | #128 | Exceptional 19.5% |
| Immigrants | England | 92.9 /100 | #129 | Exceptional 19.5% |