Thai vs Pakistani Householder Income Under 25 years
COMPARE
Thai
Pakistani
Householder Income Under 25 years
Householder Income Under 25 years Comparison
Thais
Pakistanis
$59,187
HOUSEHOLDER INCOME UNDER 25 YEARS
100.0/ 100
METRIC RATING
6th/ 347
METRIC RANK
$53,325
HOUSEHOLDER INCOME UNDER 25 YEARS
94.1/ 100
METRIC RATING
125th/ 347
METRIC RANK
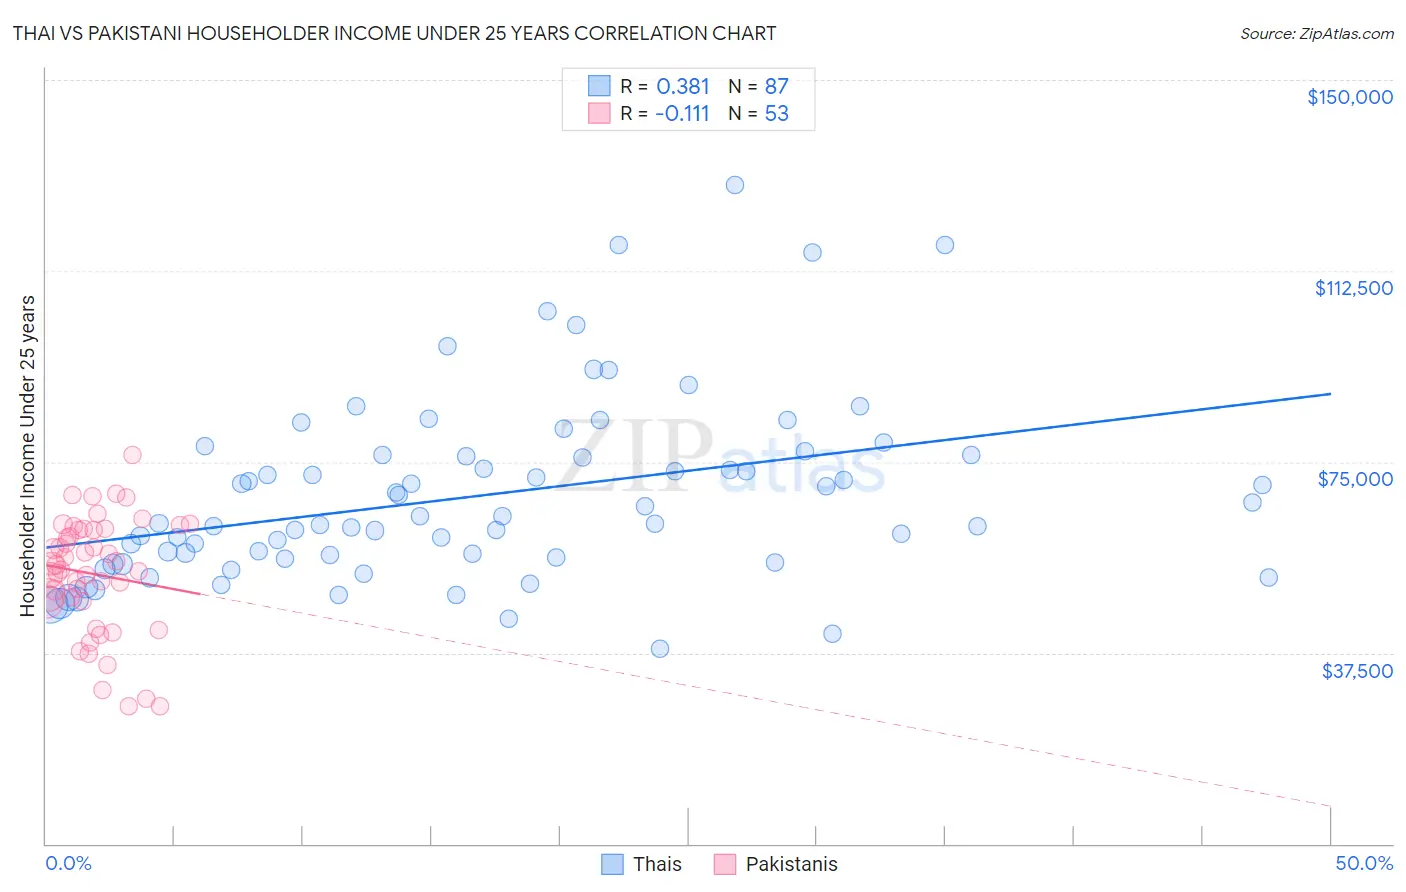
Thai vs Pakistani Householder Income Under 25 years Correlation Chart
The statistical analysis conducted on geographies consisting of 390,520,827 people shows a mild positive correlation between the proportion of Thais and household income with householder under the age of 25 in the United States with a correlation coefficient (R) of 0.381 and weighted average of $59,187. Similarly, the statistical analysis conducted on geographies consisting of 292,497,828 people shows a poor negative correlation between the proportion of Pakistanis and household income with householder under the age of 25 in the United States with a correlation coefficient (R) of -0.111 and weighted average of $53,325, a difference of 11.0%.
Householder Income Under 25 years Correlation Summary
| Measurement | Thai | Pakistani |
| Minimum | $38,359 | $27,000 |
| Maximum | $129,301 | $76,250 |
| Range | $90,942 | $49,250 |
| Mean | $68,286 | $52,946 |
| Median | $62,959 | $54,698 |
| Interquartile 25% (IQ1) | $56,029 | $47,535 |
| Interquartile 75% (IQ3) | $76,245 | $61,638 |
| Interquartile Range (IQR) | $20,216 | $14,104 |
| Standard Deviation (Sample) | $17,960 | $11,430 |
| Standard Deviation (Population) | $17,857 | $11,322 |
Similar Demographics by Householder Income Under 25 years
Demographics Similar to Thais by Householder Income Under 25 years
In terms of householder income under 25 years, the demographic groups most similar to Thais are Immigrants from Bolivia ($59,389, a difference of 0.34%), Immigrants from Taiwan ($59,424, a difference of 0.40%), Bolivian ($58,506, a difference of 1.2%), Immigrants from India ($59,914, a difference of 1.2%), and Indian (Asian) ($58,239, a difference of 1.6%).
| Demographics | Rating | Rank | Householder Income Under 25 years |
| Assyrians/Chaldeans/Syriacs | 100.0 /100 | #1 | Exceptional $65,329 |
| Immigrants | Hong Kong | 100.0 /100 | #2 | Exceptional $62,083 |
| Immigrants | India | 100.0 /100 | #3 | Exceptional $59,914 |
| Immigrants | Taiwan | 100.0 /100 | #4 | Exceptional $59,424 |
| Immigrants | Bolivia | 100.0 /100 | #5 | Exceptional $59,389 |
| Thais | 100.0 /100 | #6 | Exceptional $59,187 |
| Bolivians | 100.0 /100 | #7 | Exceptional $58,506 |
| Indians (Asian) | 100.0 /100 | #8 | Exceptional $58,239 |
| Chinese | 100.0 /100 | #9 | Exceptional $58,162 |
| Afghans | 100.0 /100 | #10 | Exceptional $58,019 |
| Immigrants | China | 100.0 /100 | #11 | Exceptional $57,931 |
| Immigrants | Philippines | 100.0 /100 | #12 | Exceptional $57,930 |
| Immigrants | South Central Asia | 100.0 /100 | #13 | Exceptional $57,818 |
| Filipinos | 100.0 /100 | #14 | Exceptional $57,740 |
| Koreans | 100.0 /100 | #15 | Exceptional $57,730 |
Demographics Similar to Pakistanis by Householder Income Under 25 years
In terms of householder income under 25 years, the demographic groups most similar to Pakistanis are Immigrants from Serbia ($53,321, a difference of 0.010%), Immigrants from North America ($53,307, a difference of 0.030%), Immigrants from Bulgaria ($53,305, a difference of 0.040%), Colombian ($53,357, a difference of 0.060%), and New Zealander ($53,294, a difference of 0.060%).
| Demographics | Rating | Rank | Householder Income Under 25 years |
| Immigrants | Switzerland | 96.3 /100 | #118 | Exceptional $53,528 |
| Italians | 95.4 /100 | #119 | Exceptional $53,426 |
| Guamanians/Chamorros | 95.3 /100 | #120 | Exceptional $53,423 |
| Immigrants | Canada | 95.2 /100 | #121 | Exceptional $53,411 |
| Immigrants | Ethiopia | 95.2 /100 | #122 | Exceptional $53,408 |
| Immigrants | Iraq | 94.9 /100 | #123 | Exceptional $53,384 |
| Colombians | 94.6 /100 | #124 | Exceptional $53,357 |
| Pakistanis | 94.1 /100 | #125 | Exceptional $53,325 |
| Immigrants | Serbia | 94.1 /100 | #126 | Exceptional $53,321 |
| Immigrants | North America | 93.9 /100 | #127 | Exceptional $53,307 |
| Immigrants | Bulgaria | 93.9 /100 | #128 | Exceptional $53,305 |
| New Zealanders | 93.7 /100 | #129 | Exceptional $53,294 |
| Nicaraguans | 93.4 /100 | #130 | Exceptional $53,275 |
| Immigrants | Nicaragua | 93.3 /100 | #131 | Exceptional $53,266 |
| Moroccans | 93.1 /100 | #132 | Exceptional $53,256 |