Thai vs Immigrants from Dominica Child Poverty Under the Age of 5
COMPARE
Thai
Immigrants from Dominica
Child Poverty Under the Age of 5
Child Poverty Under the Age of 5 Comparison
Thais
Immigrants from Dominica
12.3%
CHILD POVERTY UNDER THE AGE OF 5
100.0/ 100
METRIC RATING
4th/ 347
METRIC RANK
22.7%
CHILD POVERTY UNDER THE AGE OF 5
0.0/ 100
METRIC RATING
308th/ 347
METRIC RANK
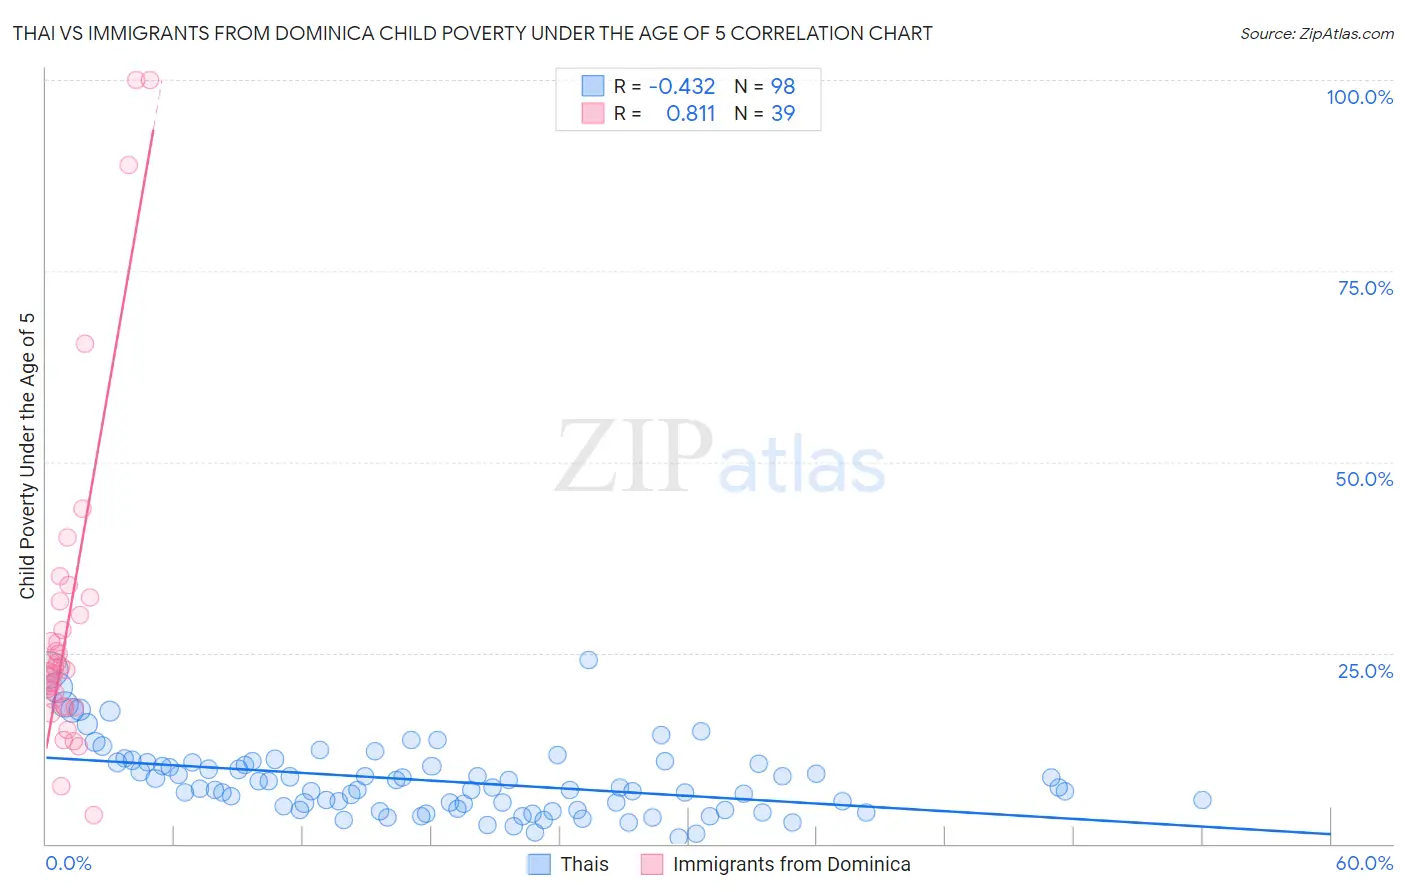
Thai vs Immigrants from Dominica Child Poverty Under the Age of 5 Correlation Chart
The statistical analysis conducted on geographies consisting of 451,866,941 people shows a moderate negative correlation between the proportion of Thais and poverty level among children under the age of 5 in the United States with a correlation coefficient (R) of -0.432 and weighted average of 12.3%. Similarly, the statistical analysis conducted on geographies consisting of 83,100,488 people shows a very strong positive correlation between the proportion of Immigrants from Dominica and poverty level among children under the age of 5 in the United States with a correlation coefficient (R) of 0.811 and weighted average of 22.7%, a difference of 84.4%.
Child Poverty Under the Age of 5 Correlation Summary
| Measurement | Thai | Immigrants from Dominica |
| Minimum | 0.85% | 3.8% |
| Maximum | 24.1% | 100.0% |
| Range | 23.3% | 96.2% |
| Mean | 8.2% | 29.6% |
| Median | 7.3% | 23.1% |
| Interquartile 25% (IQ1) | 4.5% | 17.9% |
| Interquartile 75% (IQ3) | 10.6% | 31.8% |
| Interquartile Range (IQR) | 6.1% | 13.9% |
| Standard Deviation (Sample) | 4.6% | 22.2% |
| Standard Deviation (Population) | 4.6% | 21.9% |
Similar Demographics by Child Poverty Under the Age of 5
Demographics Similar to Thais by Child Poverty Under the Age of 5
In terms of child poverty under the age of 5, the demographic groups most similar to Thais are Immigrants from Hong Kong (12.4%, a difference of 1.0%), Immigrants from Singapore (12.9%, a difference of 5.1%), Filipino (11.6%, a difference of 6.0%), Chinese (13.1%, a difference of 6.1%), and Iranian (13.1%, a difference of 6.1%).
| Demographics | Rating | Rank | Child Poverty Under the Age of 5 |
| Immigrants | India | 100.0 /100 | #1 | Exceptional 11.5% |
| Immigrants | Taiwan | 100.0 /100 | #2 | Exceptional 11.6% |
| Filipinos | 100.0 /100 | #3 | Exceptional 11.6% |
| Thais | 100.0 /100 | #4 | Exceptional 12.3% |
| Immigrants | Hong Kong | 100.0 /100 | #5 | Exceptional 12.4% |
| Immigrants | Singapore | 100.0 /100 | #6 | Exceptional 12.9% |
| Chinese | 100.0 /100 | #7 | Exceptional 13.1% |
| Iranians | 100.0 /100 | #8 | Exceptional 13.1% |
| Immigrants | Iran | 100.0 /100 | #9 | Exceptional 13.1% |
| Burmese | 100.0 /100 | #10 | Exceptional 13.2% |
| Immigrants | Korea | 100.0 /100 | #11 | Exceptional 13.2% |
| Immigrants | South Central Asia | 100.0 /100 | #12 | Exceptional 13.3% |
| Bhutanese | 100.0 /100 | #13 | Exceptional 13.4% |
| Okinawans | 100.0 /100 | #14 | Exceptional 13.4% |
| Indians (Asian) | 100.0 /100 | #15 | Exceptional 13.4% |
Demographics Similar to Immigrants from Dominica by Child Poverty Under the Age of 5
In terms of child poverty under the age of 5, the demographic groups most similar to Immigrants from Dominica are Immigrants from Bahamas (22.7%, a difference of 0.040%), Houma (22.7%, a difference of 0.14%), African (22.8%, a difference of 0.55%), Seminole (22.8%, a difference of 0.59%), and Honduran (23.0%, a difference of 1.2%).
| Demographics | Rating | Rank | Child Poverty Under the Age of 5 |
| Immigrants | Central America | 0.0 /100 | #301 | Tragic 22.0% |
| Iroquois | 0.0 /100 | #302 | Tragic 22.0% |
| Inupiat | 0.0 /100 | #303 | Tragic 22.0% |
| Immigrants | Guatemala | 0.0 /100 | #304 | Tragic 22.0% |
| Immigrants | Mexico | 0.0 /100 | #305 | Tragic 22.2% |
| Indonesians | 0.0 /100 | #306 | Tragic 22.3% |
| Immigrants | Bahamas | 0.0 /100 | #307 | Tragic 22.7% |
| Immigrants | Dominica | 0.0 /100 | #308 | Tragic 22.7% |
| Houma | 0.0 /100 | #309 | Tragic 22.7% |
| Africans | 0.0 /100 | #310 | Tragic 22.8% |
| Seminole | 0.0 /100 | #311 | Tragic 22.8% |
| Hondurans | 0.0 /100 | #312 | Tragic 23.0% |
| Bahamians | 0.0 /100 | #313 | Tragic 23.0% |
| U.S. Virgin Islanders | 0.0 /100 | #314 | Tragic 23.0% |
| Arapaho | 0.0 /100 | #315 | Tragic 23.1% |