Laotian vs Immigrants from South Eastern Asia Seniors Poverty Over the Age of 65
COMPARE
Laotian
Immigrants from South Eastern Asia
Seniors Poverty Over the Age of 65
Seniors Poverty Over the Age of 65 Comparison
Laotians
Immigrants from South Eastern Asia
10.6%
SENIORS POVERTY OVER THE AGE OF 65
79.9/ 100
METRIC RATING
145th/ 347
METRIC RANK
10.8%
SENIORS POVERTY OVER THE AGE OF 65
62.1/ 100
METRIC RATING
165th/ 347
METRIC RANK
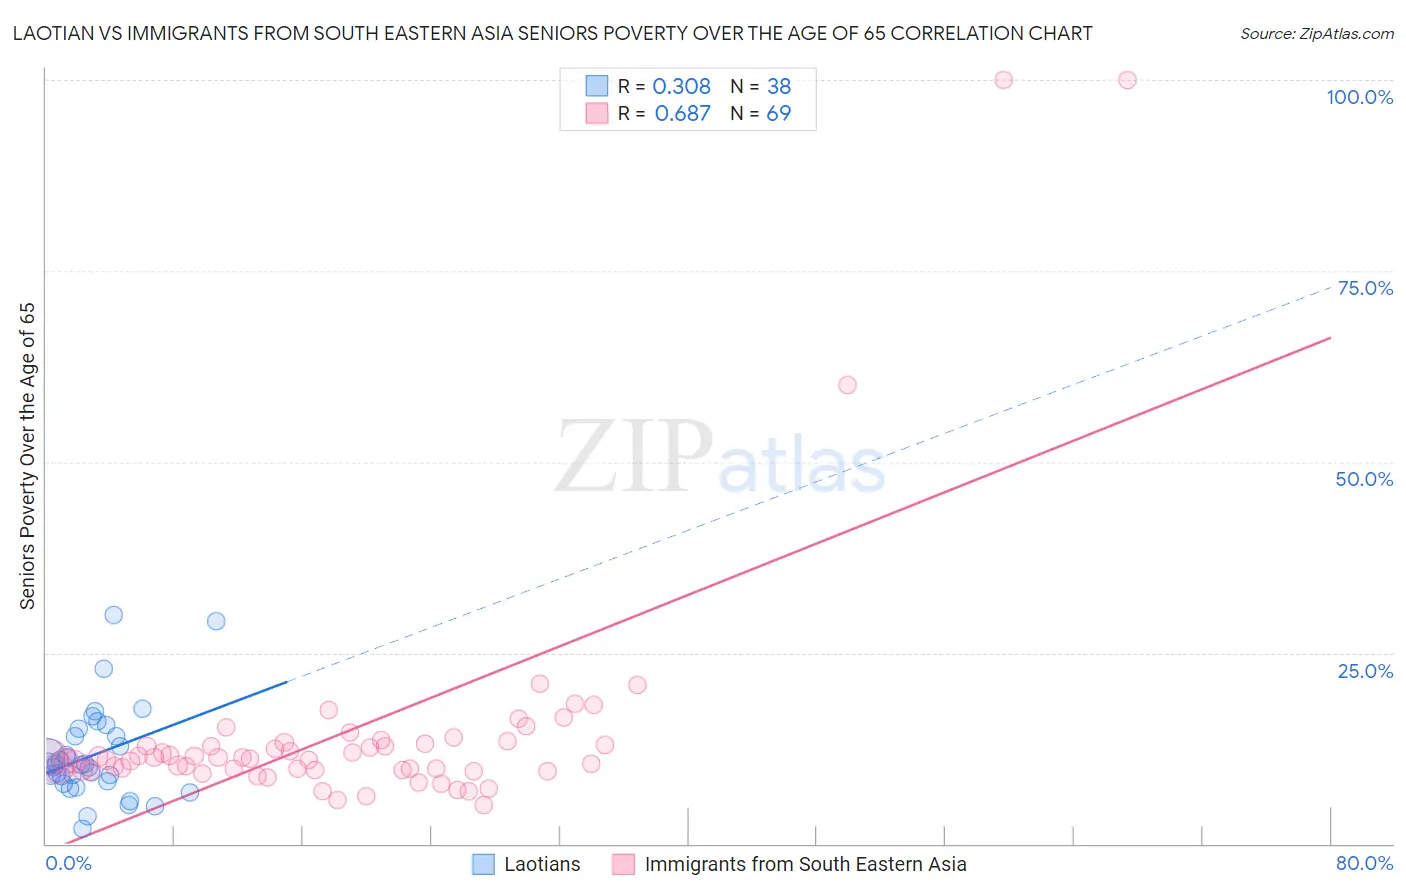
Laotian vs Immigrants from South Eastern Asia Seniors Poverty Over the Age of 65 Correlation Chart
The statistical analysis conducted on geographies consisting of 224,417,666 people shows a mild positive correlation between the proportion of Laotians and poverty level among seniors over the age of 65 in the United States with a correlation coefficient (R) of 0.308 and weighted average of 10.6%. Similarly, the statistical analysis conducted on geographies consisting of 509,715,035 people shows a significant positive correlation between the proportion of Immigrants from South Eastern Asia and poverty level among seniors over the age of 65 in the United States with a correlation coefficient (R) of 0.687 and weighted average of 10.8%, a difference of 2.0%.
Seniors Poverty Over the Age of 65 Correlation Summary
| Measurement | Laotian | Immigrants from South Eastern Asia |
| Minimum | 2.0% | 5.1% |
| Maximum | 29.9% | 100.0% |
| Range | 27.9% | 94.9% |
| Mean | 11.6% | 14.7% |
| Median | 10.4% | 11.2% |
| Interquartile 25% (IQ1) | 8.3% | 9.7% |
| Interquartile 75% (IQ3) | 14.1% | 13.2% |
| Interquartile Range (IQR) | 5.9% | 3.5% |
| Standard Deviation (Sample) | 6.0% | 16.3% |
| Standard Deviation (Population) | 6.0% | 16.2% |
Demographics Similar to Laotians and Immigrants from South Eastern Asia by Seniors Poverty Over the Age of 65
In terms of seniors poverty over the age of 65, the demographic groups most similar to Laotians are Alaskan Athabascan (10.6%, a difference of 0.10%), Immigrants from Greece (10.6%, a difference of 0.12%), American (10.6%, a difference of 0.25%), Immigrants from Cameroon (10.6%, a difference of 0.25%), and Immigrants from Switzerland (10.6%, a difference of 0.35%). Similarly, the demographic groups most similar to Immigrants from South Eastern Asia are Potawatomi (10.8%, a difference of 0.050%), Tsimshian (10.8%, a difference of 0.23%), Immigrants from Indonesia (10.8%, a difference of 0.27%), Arab (10.8%, a difference of 0.31%), and Sudanese (10.7%, a difference of 0.61%).
| Demographics | Rating | Rank | Seniors Poverty Over the Age of 65 |
| Laotians | 79.9 /100 | #145 | Good 10.6% |
| Alaskan Athabascans | 79.1 /100 | #146 | Good 10.6% |
| Immigrants | Greece | 79.0 /100 | #147 | Good 10.6% |
| Americans | 78.1 /100 | #148 | Good 10.6% |
| Immigrants | Cameroon | 78.1 /100 | #149 | Good 10.6% |
| Immigrants | Switzerland | 77.3 /100 | #150 | Good 10.6% |
| Spanish | 76.8 /100 | #151 | Good 10.6% |
| Immigrants | Egypt | 76.5 /100 | #152 | Good 10.6% |
| Fijians | 75.6 /100 | #153 | Good 10.7% |
| Immigrants | Saudi Arabia | 74.9 /100 | #154 | Good 10.7% |
| Chickasaw | 73.6 /100 | #155 | Good 10.7% |
| Ethiopians | 72.9 /100 | #156 | Good 10.7% |
| Immigrants | Ethiopia | 72.9 /100 | #157 | Good 10.7% |
| Immigrants | Sierra Leone | 71.7 /100 | #158 | Good 10.7% |
| Immigrants | Micronesia | 70.8 /100 | #159 | Good 10.7% |
| Sudanese | 68.2 /100 | #160 | Good 10.7% |
| Arabs | 65.2 /100 | #161 | Good 10.8% |
| Immigrants | Indonesia | 64.8 /100 | #162 | Good 10.8% |
| Tsimshian | 64.5 /100 | #163 | Good 10.8% |
| Potawatomi | 62.6 /100 | #164 | Good 10.8% |
| Immigrants | South Eastern Asia | 62.1 /100 | #165 | Good 10.8% |