Swedish vs Soviet Union Child Poverty Under the Age of 5
COMPARE
Swedish
Soviet Union
Child Poverty Under the Age of 5
Child Poverty Under the Age of 5 Comparison
Swedes
Soviet Union
15.0%
CHILD POVERTY UNDER THE AGE OF 5
99.4/ 100
METRIC RATING
58th/ 347
METRIC RANK
14.7%
CHILD POVERTY UNDER THE AGE OF 5
99.7/ 100
METRIC RATING
42nd/ 347
METRIC RANK
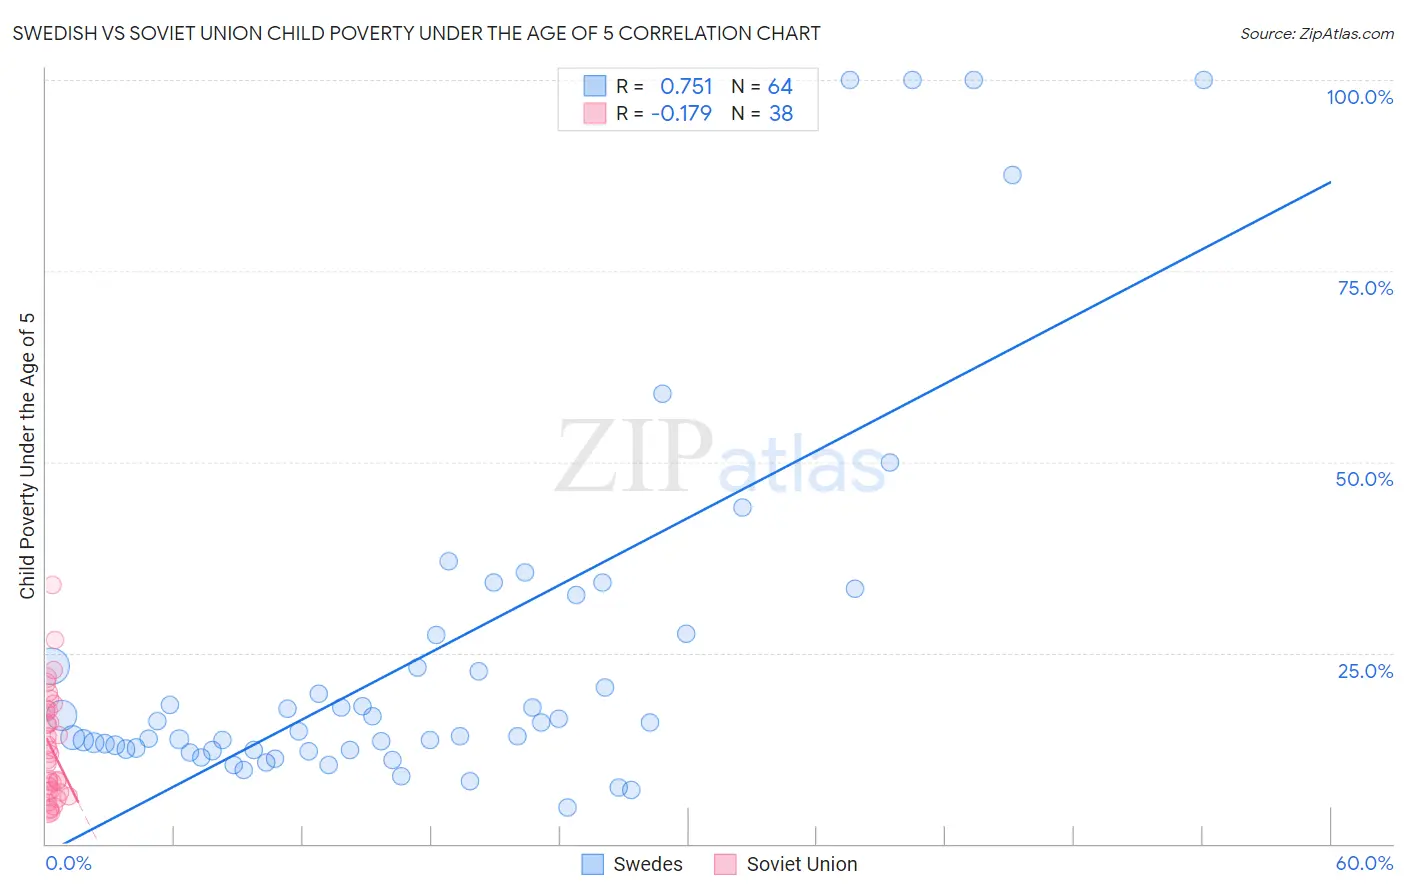
Swedish vs Soviet Union Child Poverty Under the Age of 5 Correlation Chart
The statistical analysis conducted on geographies consisting of 502,877,472 people shows a strong positive correlation between the proportion of Swedes and poverty level among children under the age of 5 in the United States with a correlation coefficient (R) of 0.751 and weighted average of 15.0%. Similarly, the statistical analysis conducted on geographies consisting of 43,034,712 people shows a poor negative correlation between the proportion of Soviet Union and poverty level among children under the age of 5 in the United States with a correlation coefficient (R) of -0.179 and weighted average of 14.7%, a difference of 1.8%.
Child Poverty Under the Age of 5 Correlation Summary
| Measurement | Swedish | Soviet Union |
| Minimum | 4.8% | 3.9% |
| Maximum | 100.0% | 33.8% |
| Range | 95.2% | 29.9% |
| Mean | 24.6% | 12.6% |
| Median | 15.2% | 11.3% |
| Interquartile 25% (IQ1) | 12.3% | 6.9% |
| Interquartile 75% (IQ3) | 25.3% | 17.4% |
| Interquartile Range (IQR) | 13.0% | 10.5% |
| Standard Deviation (Sample) | 23.8% | 7.0% |
| Standard Deviation (Population) | 23.6% | 7.0% |
Demographics Similar to Swedes and Soviet Union by Child Poverty Under the Age of 5
In terms of child poverty under the age of 5, the demographic groups most similar to Swedes are Egyptian (14.9%, a difference of 0.050%), Immigrants from Pakistan (14.9%, a difference of 0.13%), Paraguayan (15.0%, a difference of 0.15%), Danish (14.9%, a difference of 0.20%), and Immigrants from Russia (15.0%, a difference of 0.24%). Similarly, the demographic groups most similar to Soviet Union are Immigrants from Greece (14.7%, a difference of 0.0%), Immigrants from Philippines (14.7%, a difference of 0.13%), Immigrants from Belarus (14.7%, a difference of 0.16%), Laotian (14.7%, a difference of 0.26%), and Immigrants from Australia (14.6%, a difference of 0.28%).
| Demographics | Rating | Rank | Child Poverty Under the Age of 5 |
| Immigrants | Australia | 99.7 /100 | #40 | Exceptional 14.6% |
| Immigrants | Belarus | 99.7 /100 | #41 | Exceptional 14.7% |
| Soviet Union | 99.7 /100 | #42 | Exceptional 14.7% |
| Immigrants | Greece | 99.7 /100 | #43 | Exceptional 14.7% |
| Immigrants | Philippines | 99.7 /100 | #44 | Exceptional 14.7% |
| Laotians | 99.6 /100 | #45 | Exceptional 14.7% |
| Tsimshian | 99.6 /100 | #46 | Exceptional 14.7% |
| Russians | 99.6 /100 | #47 | Exceptional 14.8% |
| Immigrants | Czechoslovakia | 99.6 /100 | #48 | Exceptional 14.8% |
| Immigrants | Bulgaria | 99.6 /100 | #49 | Exceptional 14.8% |
| Immigrants | Northern Europe | 99.6 /100 | #50 | Exceptional 14.8% |
| Estonians | 99.6 /100 | #51 | Exceptional 14.8% |
| Immigrants | Serbia | 99.5 /100 | #52 | Exceptional 14.9% |
| Luxembourgers | 99.4 /100 | #53 | Exceptional 14.9% |
| Immigrants | Israel | 99.4 /100 | #54 | Exceptional 14.9% |
| Danes | 99.4 /100 | #55 | Exceptional 14.9% |
| Immigrants | Pakistan | 99.4 /100 | #56 | Exceptional 14.9% |
| Egyptians | 99.4 /100 | #57 | Exceptional 14.9% |
| Swedes | 99.4 /100 | #58 | Exceptional 15.0% |
| Paraguayans | 99.4 /100 | #59 | Exceptional 15.0% |
| Immigrants | Russia | 99.3 /100 | #60 | Exceptional 15.0% |