Swedish vs Immigrants from Sri Lanka Child Poverty Under the Age of 5
COMPARE
Swedish
Immigrants from Sri Lanka
Child Poverty Under the Age of 5
Child Poverty Under the Age of 5 Comparison
Swedes
Immigrants from Sri Lanka
15.0%
CHILD POVERTY UNDER THE AGE OF 5
99.4/ 100
METRIC RATING
58th/ 347
METRIC RANK
14.4%
CHILD POVERTY UNDER THE AGE OF 5
99.8/ 100
METRIC RATING
32nd/ 347
METRIC RANK
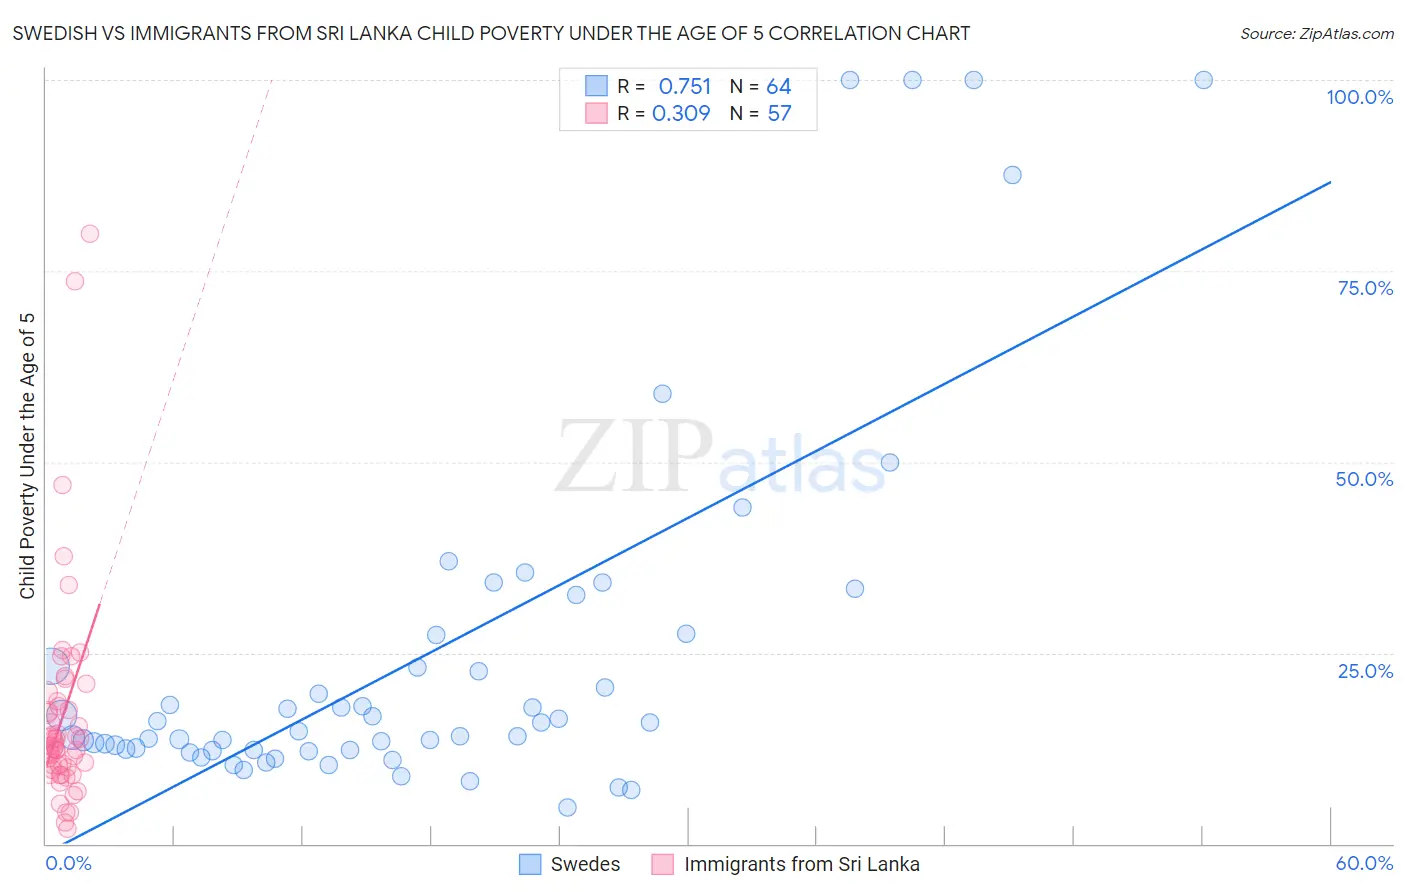
Swedish vs Immigrants from Sri Lanka Child Poverty Under the Age of 5 Correlation Chart
The statistical analysis conducted on geographies consisting of 502,877,472 people shows a strong positive correlation between the proportion of Swedes and poverty level among children under the age of 5 in the United States with a correlation coefficient (R) of 0.751 and weighted average of 15.0%. Similarly, the statistical analysis conducted on geographies consisting of 146,204,639 people shows a mild positive correlation between the proportion of Immigrants from Sri Lanka and poverty level among children under the age of 5 in the United States with a correlation coefficient (R) of 0.309 and weighted average of 14.4%, a difference of 3.5%.
Child Poverty Under the Age of 5 Correlation Summary
| Measurement | Swedish | Immigrants from Sri Lanka |
| Minimum | 4.8% | 1.9% |
| Maximum | 100.0% | 79.8% |
| Range | 95.2% | 77.9% |
| Mean | 24.6% | 16.7% |
| Median | 15.2% | 12.8% |
| Interquartile 25% (IQ1) | 12.3% | 9.8% |
| Interquartile 75% (IQ3) | 25.3% | 18.3% |
| Interquartile Range (IQR) | 13.0% | 8.5% |
| Standard Deviation (Sample) | 23.8% | 14.1% |
| Standard Deviation (Population) | 23.6% | 14.0% |
Similar Demographics by Child Poverty Under the Age of 5
Demographics Similar to Swedes by Child Poverty Under the Age of 5
In terms of child poverty under the age of 5, the demographic groups most similar to Swedes are Egyptian (14.9%, a difference of 0.050%), Immigrants from Pakistan (14.9%, a difference of 0.13%), Paraguayan (15.0%, a difference of 0.15%), Danish (14.9%, a difference of 0.20%), and Immigrants from Russia (15.0%, a difference of 0.24%).
| Demographics | Rating | Rank | Child Poverty Under the Age of 5 |
| Estonians | 99.6 /100 | #51 | Exceptional 14.8% |
| Immigrants | Serbia | 99.5 /100 | #52 | Exceptional 14.9% |
| Luxembourgers | 99.4 /100 | #53 | Exceptional 14.9% |
| Immigrants | Israel | 99.4 /100 | #54 | Exceptional 14.9% |
| Danes | 99.4 /100 | #55 | Exceptional 14.9% |
| Immigrants | Pakistan | 99.4 /100 | #56 | Exceptional 14.9% |
| Egyptians | 99.4 /100 | #57 | Exceptional 14.9% |
| Swedes | 99.4 /100 | #58 | Exceptional 15.0% |
| Paraguayans | 99.4 /100 | #59 | Exceptional 15.0% |
| Immigrants | Russia | 99.3 /100 | #60 | Exceptional 15.0% |
| Immigrants | Poland | 99.1 /100 | #61 | Exceptional 15.1% |
| Immigrants | Eastern Europe | 99.1 /100 | #62 | Exceptional 15.1% |
| Immigrants | Europe | 99.1 /100 | #63 | Exceptional 15.1% |
| Immigrants | Romania | 99.1 /100 | #64 | Exceptional 15.2% |
| Immigrants | Fiji | 99.0 /100 | #65 | Exceptional 15.2% |
Demographics Similar to Immigrants from Sri Lanka by Child Poverty Under the Age of 5
In terms of child poverty under the age of 5, the demographic groups most similar to Immigrants from Sri Lanka are Korean (14.4%, a difference of 0.28%), Taiwanese (14.5%, a difference of 0.30%), Cambodian (14.4%, a difference of 0.31%), Immigrants from Asia (14.4%, a difference of 0.36%), and Immigrants from Moldova (14.5%, a difference of 0.40%).
| Demographics | Rating | Rank | Child Poverty Under the Age of 5 |
| Cypriots | 99.9 /100 | #25 | Exceptional 14.0% |
| Immigrants | Lithuania | 99.9 /100 | #26 | Exceptional 14.1% |
| Tongans | 99.9 /100 | #27 | Exceptional 14.2% |
| Immigrants | Indonesia | 99.8 /100 | #28 | Exceptional 14.3% |
| Immigrants | Asia | 99.8 /100 | #29 | Exceptional 14.4% |
| Cambodians | 99.8 /100 | #30 | Exceptional 14.4% |
| Koreans | 99.8 /100 | #31 | Exceptional 14.4% |
| Immigrants | Sri Lanka | 99.8 /100 | #32 | Exceptional 14.4% |
| Taiwanese | 99.8 /100 | #33 | Exceptional 14.5% |
| Immigrants | Moldova | 99.8 /100 | #34 | Exceptional 14.5% |
| Latvians | 99.8 /100 | #35 | Exceptional 14.5% |
| Maltese | 99.8 /100 | #36 | Exceptional 14.5% |
| Turks | 99.7 /100 | #37 | Exceptional 14.6% |
| Eastern Europeans | 99.7 /100 | #38 | Exceptional 14.6% |
| Norwegians | 99.7 /100 | #39 | Exceptional 14.6% |