Immigrants from Moldova vs Immigrants from Northern Europe Female Poverty
COMPARE
Immigrants from Moldova
Immigrants from Northern Europe
Female Poverty
Female Poverty Comparison
Immigrants from Moldova
Immigrants from Northern Europe
11.9%
FEMALE POVERTY
99.2/ 100
METRIC RATING
42nd/ 347
METRIC RANK
11.6%
FEMALE POVERTY
99.6/ 100
METRIC RATING
25th/ 347
METRIC RANK
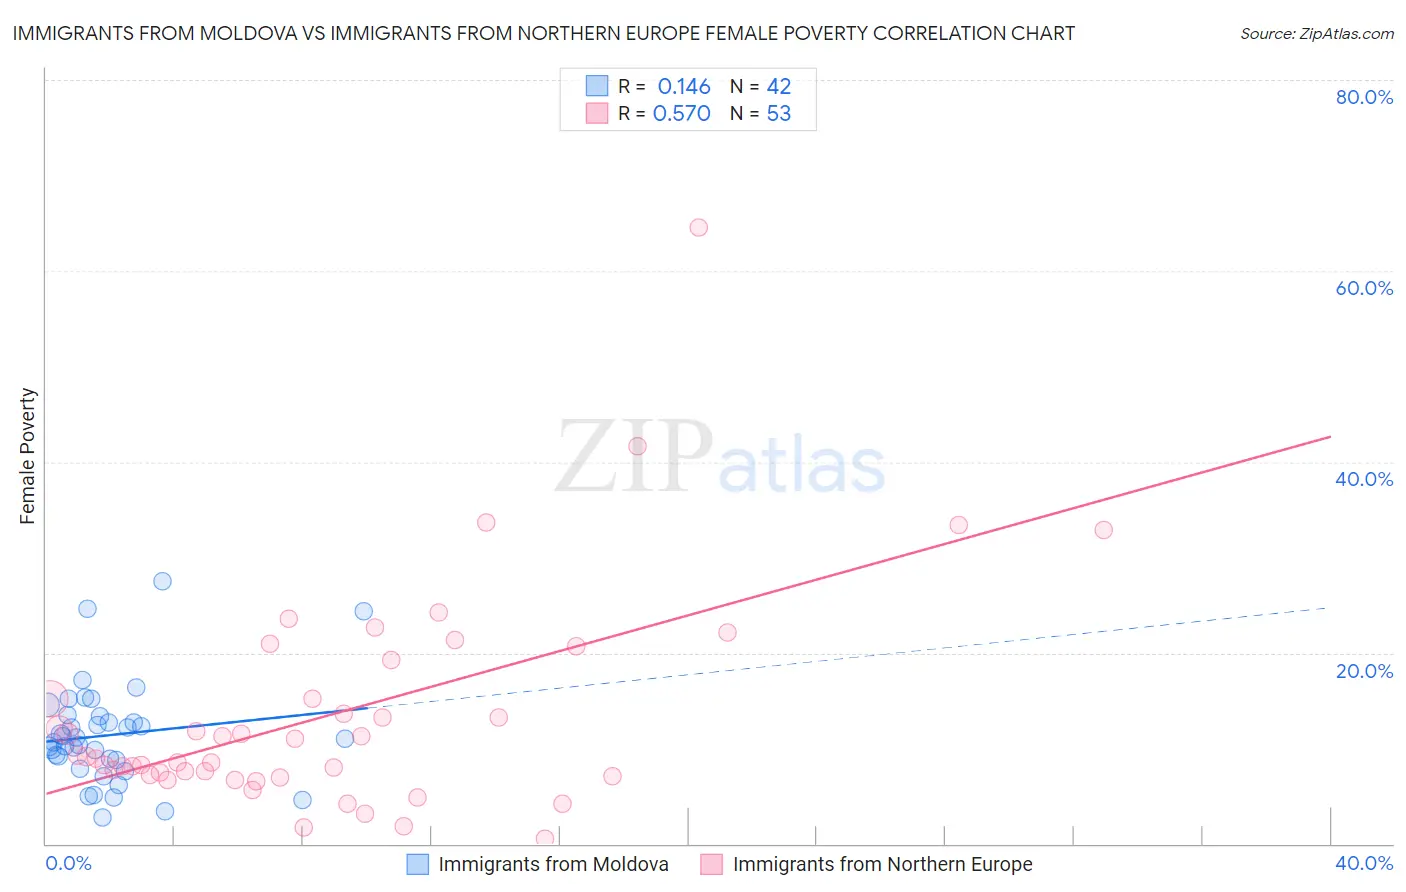
Immigrants from Moldova vs Immigrants from Northern Europe Female Poverty Correlation Chart
The statistical analysis conducted on geographies consisting of 124,368,843 people shows a poor positive correlation between the proportion of Immigrants from Moldova and poverty level among females in the United States with a correlation coefficient (R) of 0.146 and weighted average of 11.9%. Similarly, the statistical analysis conducted on geographies consisting of 476,749,265 people shows a substantial positive correlation between the proportion of Immigrants from Northern Europe and poverty level among females in the United States with a correlation coefficient (R) of 0.570 and weighted average of 11.6%, a difference of 2.0%.
Female Poverty Correlation Summary
| Measurement | Immigrants from Moldova | Immigrants from Northern Europe |
| Minimum | 2.8% | 0.47% |
| Maximum | 27.5% | 64.6% |
| Range | 24.7% | 64.1% |
| Mean | 11.4% | 13.5% |
| Median | 10.8% | 9.1% |
| Interquartile 25% (IQ1) | 8.7% | 7.2% |
| Interquartile 75% (IQ3) | 13.3% | 17.2% |
| Interquartile Range (IQR) | 4.6% | 10.1% |
| Standard Deviation (Sample) | 5.3% | 11.4% |
| Standard Deviation (Population) | 5.2% | 11.3% |
Demographics Similar to Immigrants from Moldova and Immigrants from Northern Europe by Female Poverty
In terms of female poverty, the demographic groups most similar to Immigrants from Moldova are Czech (11.9%, a difference of 0.0%), Korean (11.9%, a difference of 0.040%), Macedonian (11.8%, a difference of 0.18%), Immigrants from Poland (11.8%, a difference of 0.23%), and Russian (11.8%, a difference of 0.44%). Similarly, the demographic groups most similar to Immigrants from Northern Europe are Croatian (11.6%, a difference of 0.0%), Iranian (11.7%, a difference of 0.11%), Luxembourger (11.6%, a difference of 0.26%), Burmese (11.6%, a difference of 0.28%), and Immigrants from Korea (11.7%, a difference of 0.32%).
| Demographics | Rating | Rank | Female Poverty |
| Burmese | 99.7 /100 | #23 | Exceptional 11.6% |
| Luxembourgers | 99.7 /100 | #24 | Exceptional 11.6% |
| Immigrants | Northern Europe | 99.6 /100 | #25 | Exceptional 11.6% |
| Croatians | 99.6 /100 | #26 | Exceptional 11.6% |
| Iranians | 99.6 /100 | #27 | Exceptional 11.7% |
| Immigrants | Korea | 99.6 /100 | #28 | Exceptional 11.7% |
| Immigrants | North Macedonia | 99.6 /100 | #29 | Exceptional 11.7% |
| Greeks | 99.5 /100 | #30 | Exceptional 11.7% |
| Poles | 99.5 /100 | #31 | Exceptional 11.7% |
| Danes | 99.5 /100 | #32 | Exceptional 11.7% |
| Cypriots | 99.5 /100 | #33 | Exceptional 11.8% |
| Immigrants | Singapore | 99.4 /100 | #34 | Exceptional 11.8% |
| Immigrants | Iran | 99.4 /100 | #35 | Exceptional 11.8% |
| Immigrants | Pakistan | 99.4 /100 | #36 | Exceptional 11.8% |
| Immigrants | Greece | 99.3 /100 | #37 | Exceptional 11.8% |
| Russians | 99.3 /100 | #38 | Exceptional 11.8% |
| Immigrants | Poland | 99.3 /100 | #39 | Exceptional 11.8% |
| Macedonians | 99.3 /100 | #40 | Exceptional 11.8% |
| Czechs | 99.2 /100 | #41 | Exceptional 11.9% |
| Immigrants | Moldova | 99.2 /100 | #42 | Exceptional 11.9% |
| Koreans | 99.2 /100 | #43 | Exceptional 11.9% |