Sudanese vs Immigrants from Cabo Verde Female Poverty Among 18-24 Year Olds
COMPARE
Sudanese
Immigrants from Cabo Verde
Female Poverty Among 18-24 Year Olds
Female Poverty Among 18-24 Year Olds Comparison
Sudanese
Immigrants from Cabo Verde
23.0%
FEMALE POVERTY AMONG 18-24 YEAR OLDS
0.0/ 100
METRIC RATING
304th/ 347
METRIC RANK
19.0%
FEMALE POVERTY AMONG 18-24 YEAR OLDS
99.0/ 100
METRIC RATING
89th/ 347
METRIC RANK
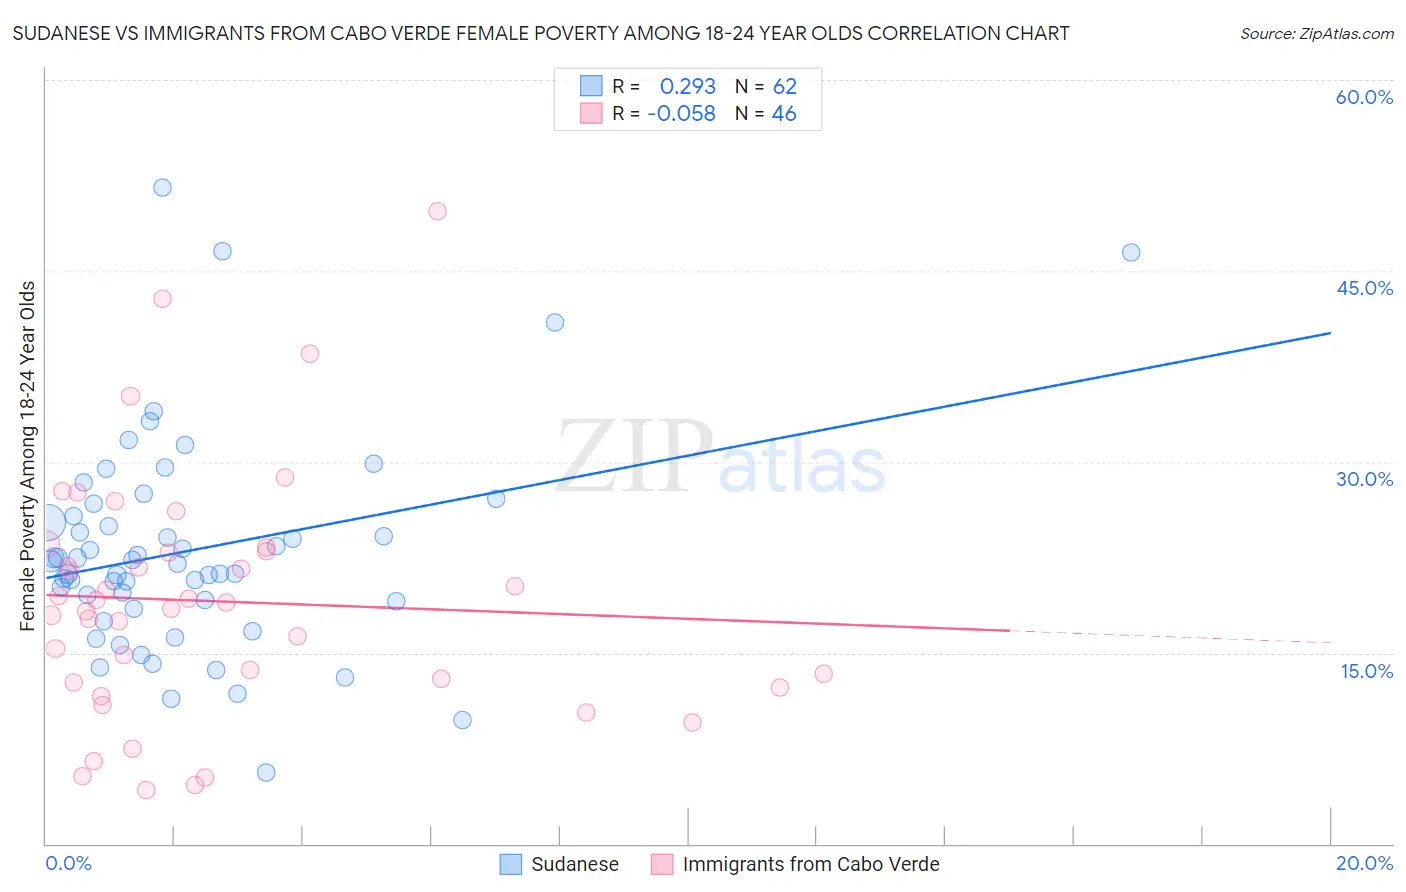
Sudanese vs Immigrants from Cabo Verde Female Poverty Among 18-24 Year Olds Correlation Chart
The statistical analysis conducted on geographies consisting of 109,658,640 people shows a weak positive correlation between the proportion of Sudanese and poverty level among females between the ages 18 and 24 in the United States with a correlation coefficient (R) of 0.293 and weighted average of 23.0%. Similarly, the statistical analysis conducted on geographies consisting of 37,707,106 people shows a slight negative correlation between the proportion of Immigrants from Cabo Verde and poverty level among females between the ages 18 and 24 in the United States with a correlation coefficient (R) of -0.058 and weighted average of 19.0%, a difference of 21.4%.
Female Poverty Among 18-24 Year Olds Correlation Summary
| Measurement | Sudanese | Immigrants from Cabo Verde |
| Minimum | 5.6% | 4.2% |
| Maximum | 51.6% | 49.6% |
| Range | 46.0% | 45.4% |
| Mean | 23.0% | 19.0% |
| Median | 22.1% | 18.7% |
| Interquartile 25% (IQ1) | 19.1% | 12.7% |
| Interquartile 75% (IQ3) | 25.7% | 23.0% |
| Interquartile Range (IQR) | 6.7% | 10.3% |
| Standard Deviation (Sample) | 8.4% | 9.7% |
| Standard Deviation (Population) | 8.4% | 9.6% |
Similar Demographics by Female Poverty Among 18-24 Year Olds
Demographics Similar to Sudanese by Female Poverty Among 18-24 Year Olds
In terms of female poverty among 18-24 year olds, the demographic groups most similar to Sudanese are Immigrants from Kuwait (23.0%, a difference of 0.050%), Senegalese (23.0%, a difference of 0.14%), Iroquois (22.9%, a difference of 0.30%), Seminole (22.9%, a difference of 0.69%), and African (22.8%, a difference of 0.77%).
| Demographics | Rating | Rank | Female Poverty Among 18-24 Year Olds |
| Inupiat | 0.0 /100 | #297 | Tragic 22.6% |
| Central American Indians | 0.0 /100 | #298 | Tragic 22.6% |
| Cherokee | 0.0 /100 | #299 | Tragic 22.7% |
| Africans | 0.0 /100 | #300 | Tragic 22.8% |
| Seminole | 0.0 /100 | #301 | Tragic 22.9% |
| Iroquois | 0.0 /100 | #302 | Tragic 22.9% |
| Senegalese | 0.0 /100 | #303 | Tragic 23.0% |
| Sudanese | 0.0 /100 | #304 | Tragic 23.0% |
| Immigrants | Kuwait | 0.0 /100 | #305 | Tragic 23.0% |
| Paiute | 0.0 /100 | #306 | Tragic 23.3% |
| Cree | 0.0 /100 | #307 | Tragic 23.4% |
| Immigrants | Sudan | 0.0 /100 | #308 | Tragic 23.5% |
| Blackfeet | 0.0 /100 | #309 | Tragic 23.6% |
| Comanche | 0.0 /100 | #310 | Tragic 23.6% |
| Potawatomi | 0.0 /100 | #311 | Tragic 23.7% |
Demographics Similar to Immigrants from Cabo Verde by Female Poverty Among 18-24 Year Olds
In terms of female poverty among 18-24 year olds, the demographic groups most similar to Immigrants from Cabo Verde are Croatian (19.0%, a difference of 0.020%), Afghan (19.0%, a difference of 0.030%), Romanian (19.0%, a difference of 0.12%), Immigrants from Jamaica (18.9%, a difference of 0.17%), and Filipino (19.0%, a difference of 0.17%).
| Demographics | Rating | Rank | Female Poverty Among 18-24 Year Olds |
| Immigrants | Uruguay | 99.4 /100 | #82 | Exceptional 18.8% |
| Immigrants | Indonesia | 99.4 /100 | #83 | Exceptional 18.9% |
| Burmese | 99.2 /100 | #84 | Exceptional 18.9% |
| Immigrants | Armenia | 99.2 /100 | #85 | Exceptional 18.9% |
| Immigrants | Iraq | 99.2 /100 | #86 | Exceptional 18.9% |
| Immigrants | Jamaica | 99.2 /100 | #87 | Exceptional 18.9% |
| Croatians | 99.1 /100 | #88 | Exceptional 19.0% |
| Immigrants | Cabo Verde | 99.0 /100 | #89 | Exceptional 19.0% |
| Afghans | 99.0 /100 | #90 | Exceptional 19.0% |
| Romanians | 98.9 /100 | #91 | Exceptional 19.0% |
| Filipinos | 98.9 /100 | #92 | Exceptional 19.0% |
| Haitians | 98.9 /100 | #93 | Exceptional 19.0% |
| Ukrainians | 98.8 /100 | #94 | Exceptional 19.0% |
| Guamanians/Chamorros | 98.8 /100 | #95 | Exceptional 19.0% |
| Sierra Leoneans | 98.7 /100 | #96 | Exceptional 19.0% |