Sudanese vs Immigrants from the Azores Seniors Poverty Over the Age of 75
COMPARE
Sudanese
Immigrants from the Azores
Seniors Poverty Over the Age of 75
Seniors Poverty Over the Age of 75 Comparison
Sudanese
Immigrants from the Azores
11.8%
SENIORS POVERTY OVER THE AGE OF 75
83.6/ 100
METRIC RATING
125th/ 347
METRIC RANK
15.2%
SENIORS POVERTY OVER THE AGE OF 75
0.0/ 100
METRIC RATING
290th/ 347
METRIC RANK
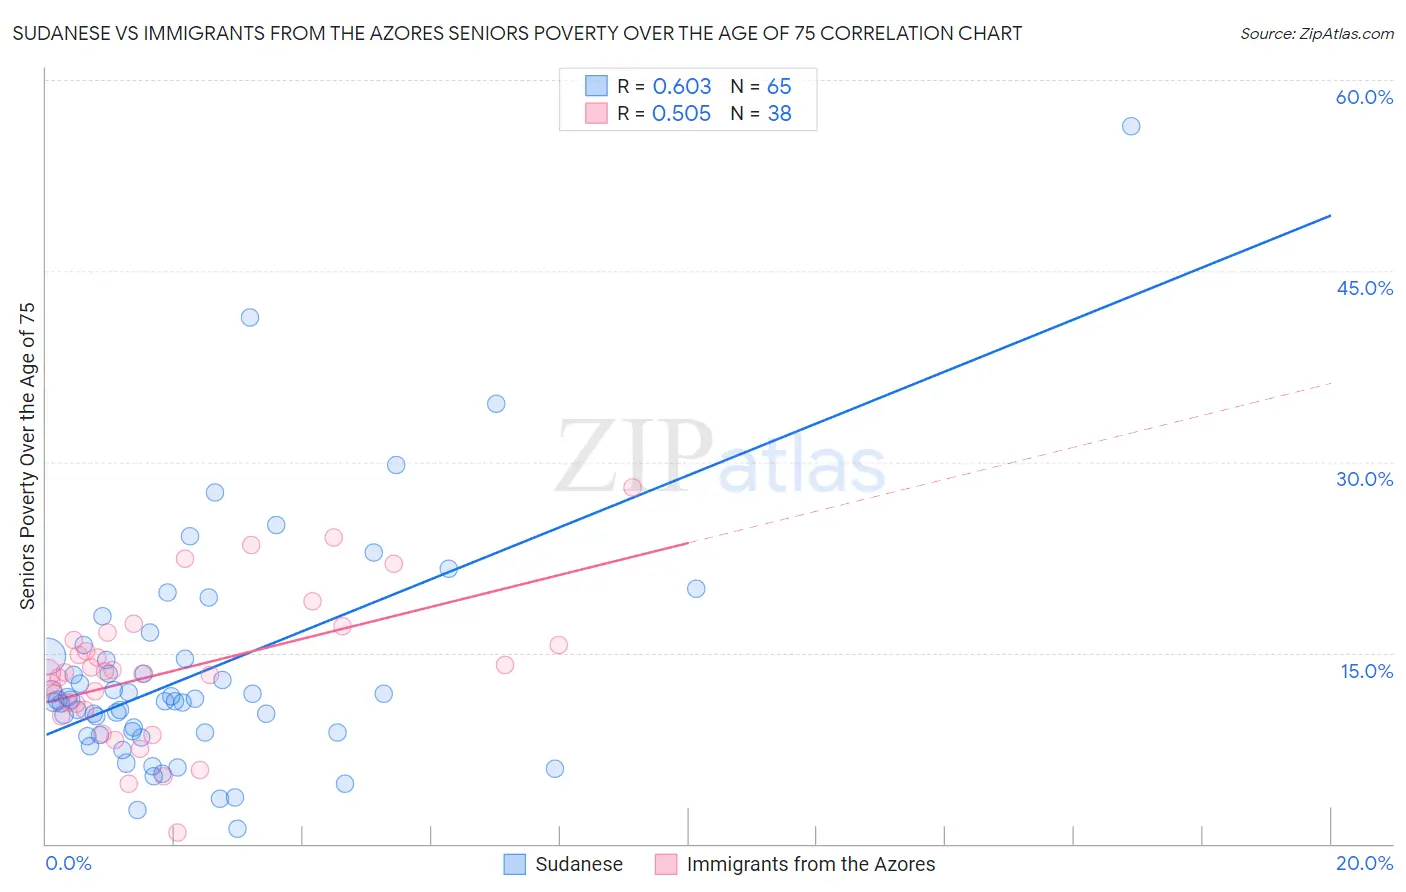
Sudanese vs Immigrants from the Azores Seniors Poverty Over the Age of 75 Correlation Chart
The statistical analysis conducted on geographies consisting of 109,744,801 people shows a significant positive correlation between the proportion of Sudanese and poverty level among seniors over the age of 75 in the United States with a correlation coefficient (R) of 0.603 and weighted average of 11.8%. Similarly, the statistical analysis conducted on geographies consisting of 46,090,908 people shows a substantial positive correlation between the proportion of Immigrants from the Azores and poverty level among seniors over the age of 75 in the United States with a correlation coefficient (R) of 0.505 and weighted average of 15.2%, a difference of 28.8%.
Seniors Poverty Over the Age of 75 Correlation Summary
| Measurement | Sudanese | Immigrants from the Azores |
| Minimum | 1.2% | 0.91% |
| Maximum | 56.4% | 28.0% |
| Range | 55.2% | 27.1% |
| Mean | 13.4% | 13.6% |
| Median | 11.3% | 13.4% |
| Interquartile 25% (IQ1) | 8.6% | 10.5% |
| Interquartile 75% (IQ3) | 14.6% | 16.0% |
| Interquartile Range (IQR) | 6.0% | 5.5% |
| Standard Deviation (Sample) | 9.1% | 5.6% |
| Standard Deviation (Population) | 9.1% | 5.6% |
Similar Demographics by Seniors Poverty Over the Age of 75
Demographics Similar to Sudanese by Seniors Poverty Over the Age of 75
In terms of seniors poverty over the age of 75, the demographic groups most similar to Sudanese are Fijian (11.8%, a difference of 0.030%), Pennsylvania German (11.8%, a difference of 0.040%), Pakistani (11.8%, a difference of 0.060%), Immigrants from Italy (11.8%, a difference of 0.060%), and Malaysian (11.8%, a difference of 0.070%).
| Demographics | Rating | Rank | Seniors Poverty Over the Age of 75 |
| Immigrants | Zimbabwe | 85.5 /100 | #118 | Excellent 11.7% |
| Immigrants | Uganda | 84.8 /100 | #119 | Excellent 11.8% |
| Immigrants | Nepal | 84.5 /100 | #120 | Excellent 11.8% |
| Malaysians | 84.1 /100 | #121 | Excellent 11.8% |
| Pakistanis | 84.0 /100 | #122 | Excellent 11.8% |
| Immigrants | Italy | 84.0 /100 | #123 | Excellent 11.8% |
| Fijians | 83.8 /100 | #124 | Excellent 11.8% |
| Sudanese | 83.6 /100 | #125 | Excellent 11.8% |
| Pennsylvania Germans | 83.4 /100 | #126 | Excellent 11.8% |
| Immigrants | Denmark | 82.6 /100 | #127 | Excellent 11.8% |
| Immigrants | Hungary | 81.7 /100 | #128 | Excellent 11.8% |
| Ethiopians | 80.7 /100 | #129 | Excellent 11.8% |
| Spanish | 80.5 /100 | #130 | Excellent 11.8% |
| Immigrants | Western Europe | 79.6 /100 | #131 | Good 11.9% |
| Lebanese | 78.3 /100 | #132 | Good 11.9% |
Demographics Similar to Immigrants from the Azores by Seniors Poverty Over the Age of 75
In terms of seniors poverty over the age of 75, the demographic groups most similar to Immigrants from the Azores are Immigrants from Belize (15.2%, a difference of 0.020%), Paiute (15.2%, a difference of 0.020%), Colville (15.2%, a difference of 0.20%), Jamaican (15.1%, a difference of 0.28%), and Apache (15.3%, a difference of 0.60%).
| Demographics | Rating | Rank | Seniors Poverty Over the Age of 75 |
| Guatemalans | 0.0 /100 | #283 | Tragic 14.8% |
| Cheyenne | 0.0 /100 | #284 | Tragic 14.9% |
| Immigrants | Mexico | 0.0 /100 | #285 | Tragic 14.9% |
| Immigrants | Central America | 0.0 /100 | #286 | Tragic 15.0% |
| Immigrants | Guatemala | 0.0 /100 | #287 | Tragic 15.1% |
| Jamaicans | 0.0 /100 | #288 | Tragic 15.1% |
| Immigrants | Belize | 0.0 /100 | #289 | Tragic 15.2% |
| Immigrants | Azores | 0.0 /100 | #290 | Tragic 15.2% |
| Paiute | 0.0 /100 | #291 | Tragic 15.2% |
| Colville | 0.0 /100 | #292 | Tragic 15.2% |
| Apache | 0.0 /100 | #293 | Tragic 15.3% |
| Immigrants | Jamaica | 0.0 /100 | #294 | Tragic 15.3% |
| U.S. Virgin Islanders | 0.0 /100 | #295 | Tragic 15.4% |
| Yuman | 0.0 /100 | #296 | Tragic 15.4% |
| Hondurans | 0.0 /100 | #297 | Tragic 15.4% |