Spanish vs Immigrants from Venezuela Male Poverty
COMPARE
Spanish
Immigrants from Venezuela
Male Poverty
Male Poverty Comparison
Spanish
Immigrants from Venezuela
11.7%
MALE POVERTY
14.1/ 100
METRIC RATING
199th/ 347
METRIC RANK
11.0%
MALE POVERTY
67.9/ 100
METRIC RATING
149th/ 347
METRIC RANK
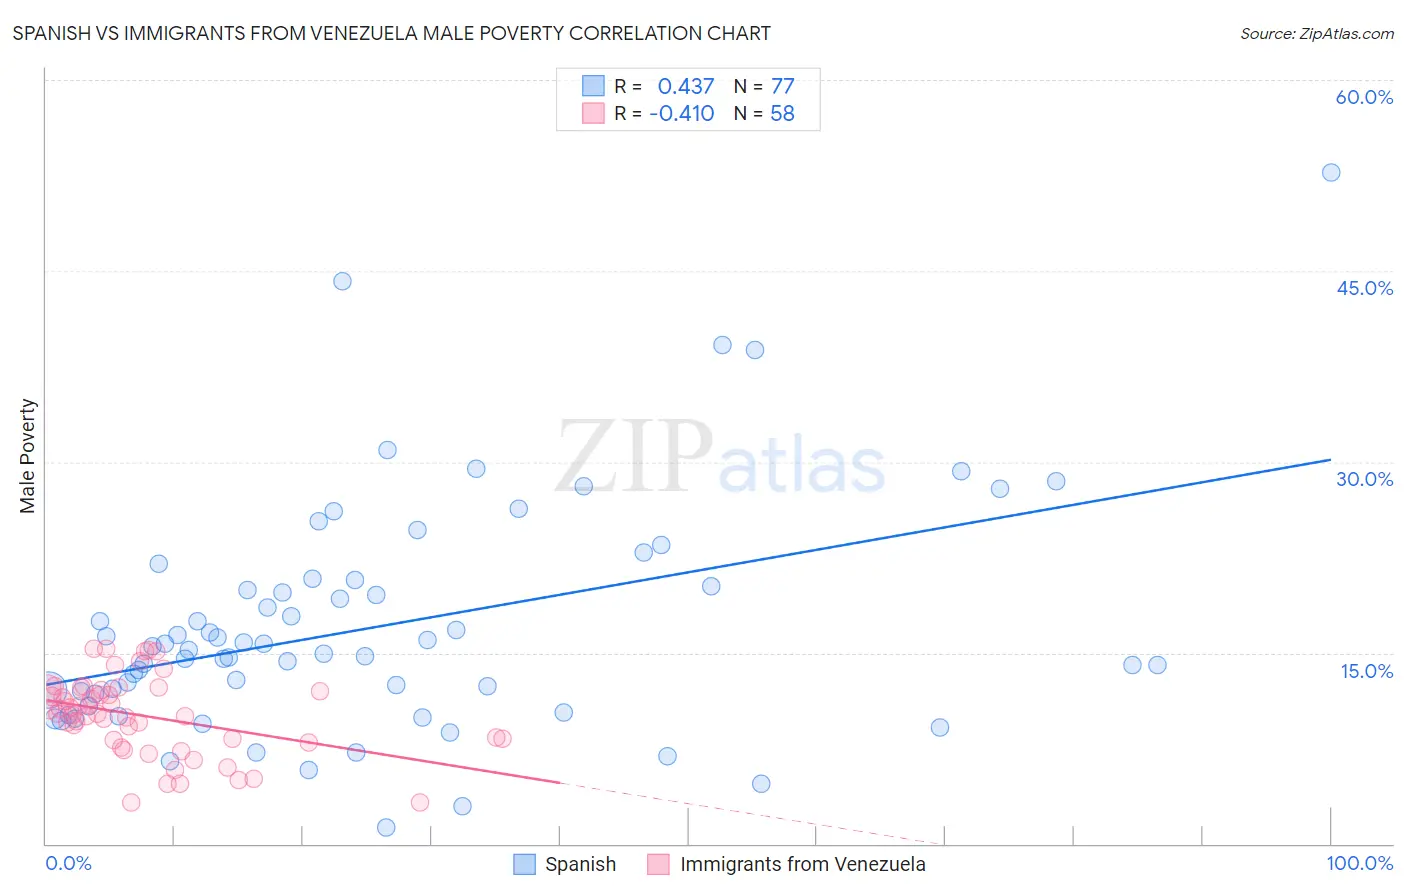
Spanish vs Immigrants from Venezuela Male Poverty Correlation Chart
The statistical analysis conducted on geographies consisting of 421,778,178 people shows a moderate positive correlation between the proportion of Spanish and poverty level among males in the United States with a correlation coefficient (R) of 0.437 and weighted average of 11.7%. Similarly, the statistical analysis conducted on geographies consisting of 287,626,289 people shows a moderate negative correlation between the proportion of Immigrants from Venezuela and poverty level among males in the United States with a correlation coefficient (R) of -0.410 and weighted average of 11.0%, a difference of 6.4%.
Male Poverty Correlation Summary
| Measurement | Spanish | Immigrants from Venezuela |
| Minimum | 1.2% | 3.2% |
| Maximum | 52.7% | 15.3% |
| Range | 51.5% | 12.2% |
| Mean | 17.1% | 10.0% |
| Median | 15.2% | 10.2% |
| Interquartile 25% (IQ1) | 11.3% | 8.2% |
| Interquartile 75% (IQ3) | 20.4% | 12.1% |
| Interquartile Range (IQR) | 9.1% | 3.9% |
| Standard Deviation (Sample) | 9.1% | 3.1% |
| Standard Deviation (Population) | 9.0% | 3.0% |
Similar Demographics by Male Poverty
Demographics Similar to Spanish by Male Poverty
In terms of male poverty, the demographic groups most similar to Spanish are Immigrants from Lebanon (11.7%, a difference of 0.10%), Iraqi (11.7%, a difference of 0.11%), Spaniard (11.7%, a difference of 0.11%), Delaware (11.7%, a difference of 0.24%), and Arab (11.6%, a difference of 0.31%).
| Demographics | Rating | Rank | Male Poverty |
| Immigrants | Uruguay | 19.1 /100 | #192 | Poor 11.6% |
| Immigrants | Kuwait | 17.3 /100 | #193 | Poor 11.6% |
| Immigrants | Kenya | 16.1 /100 | #194 | Poor 11.6% |
| Arabs | 15.8 /100 | #195 | Poor 11.6% |
| Hmong | 15.8 /100 | #196 | Poor 11.6% |
| Delaware | 15.4 /100 | #197 | Poor 11.7% |
| Iraqis | 14.7 /100 | #198 | Poor 11.7% |
| Spanish | 14.1 /100 | #199 | Poor 11.7% |
| Immigrants | Lebanon | 13.6 /100 | #200 | Poor 11.7% |
| Spaniards | 13.5 /100 | #201 | Poor 11.7% |
| Aleuts | 10.4 /100 | #202 | Poor 11.8% |
| Immigrants | Western Asia | 9.8 /100 | #203 | Tragic 11.8% |
| Immigrants | Uganda | 8.5 /100 | #204 | Tragic 11.8% |
| Panamanians | 6.2 /100 | #205 | Tragic 11.9% |
| Immigrants | Eastern Africa | 5.4 /100 | #206 | Tragic 12.0% |
Demographics Similar to Immigrants from Venezuela by Male Poverty
In terms of male poverty, the demographic groups most similar to Immigrants from Venezuela are Armenian (11.0%, a difference of 0.020%), Guamanian/Chamorro (11.0%, a difference of 0.040%), Venezuelan (11.0%, a difference of 0.060%), Icelander (11.0%, a difference of 0.070%), and Immigrants from Nepal (11.0%, a difference of 0.070%).
| Demographics | Rating | Rank | Male Poverty |
| Basques | 74.6 /100 | #142 | Good 10.9% |
| Afghans | 71.9 /100 | #143 | Good 10.9% |
| Samoans | 71.8 /100 | #144 | Good 10.9% |
| Immigrants | Germany | 71.6 /100 | #145 | Good 10.9% |
| Syrians | 71.4 /100 | #146 | Good 10.9% |
| Icelanders | 68.5 /100 | #147 | Good 11.0% |
| Armenians | 68.0 /100 | #148 | Good 11.0% |
| Immigrants | Venezuela | 67.9 /100 | #149 | Good 11.0% |
| Guamanians/Chamorros | 67.6 /100 | #150 | Good 11.0% |
| Venezuelans | 67.4 /100 | #151 | Good 11.0% |
| Immigrants | Nepal | 67.3 /100 | #152 | Good 11.0% |
| Immigrants | Bosnia and Herzegovina | 65.2 /100 | #153 | Good 11.0% |
| Immigrants | Kazakhstan | 64.8 /100 | #154 | Good 11.0% |
| Immigrants | Malaysia | 64.7 /100 | #155 | Good 11.0% |
| Costa Ricans | 63.9 /100 | #156 | Good 11.0% |