Spanish vs Immigrants from Syria Male Poverty
COMPARE
Spanish
Immigrants from Syria
Male Poverty
Male Poverty Comparison
Spanish
Immigrants from Syria
11.7%
MALE POVERTY
14.1/ 100
METRIC RATING
199th/ 347
METRIC RANK
11.3%
MALE POVERTY
40.3/ 100
METRIC RATING
179th/ 347
METRIC RANK
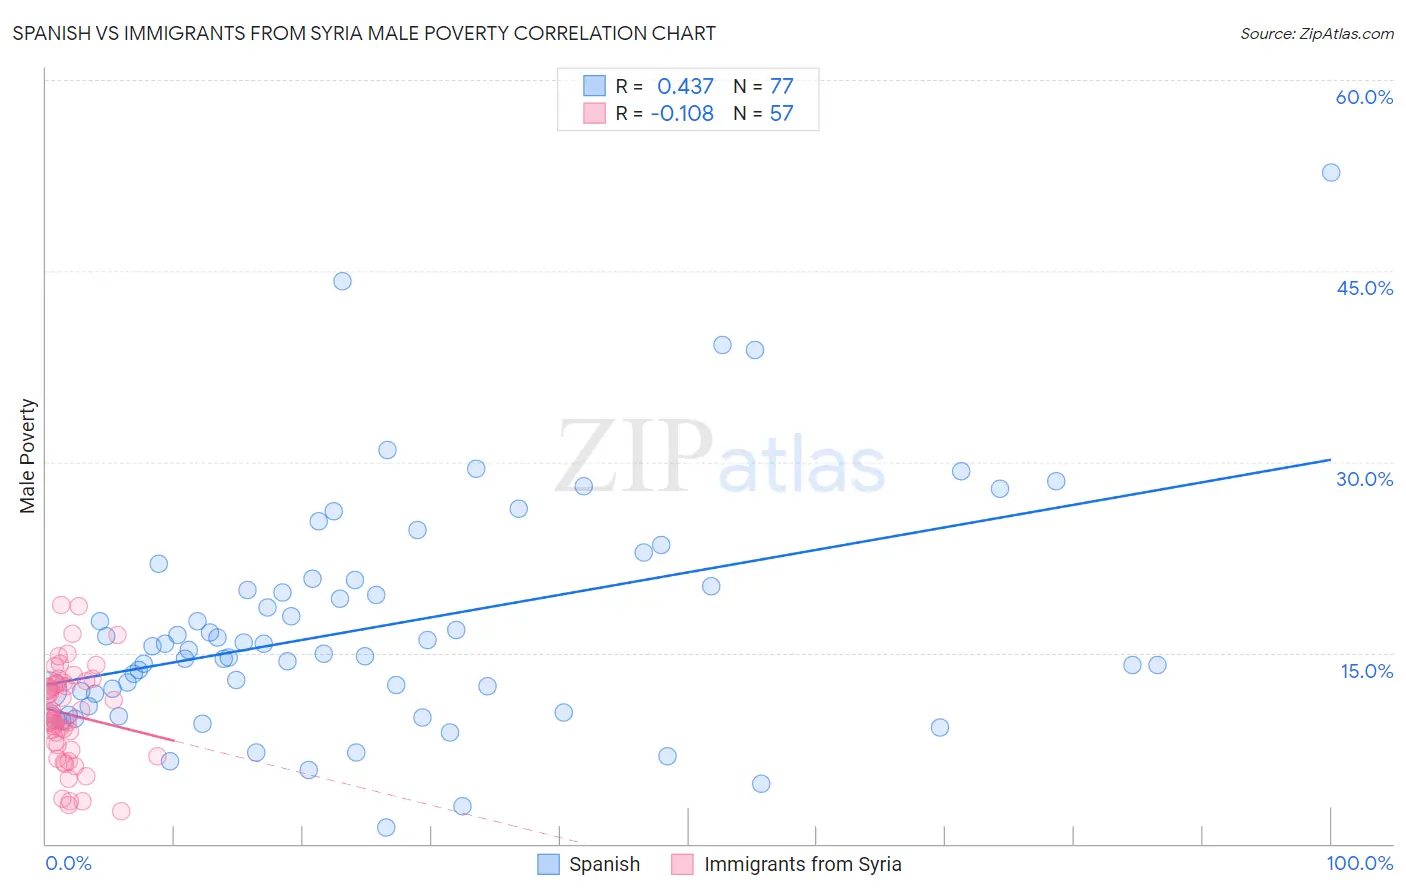
Spanish vs Immigrants from Syria Male Poverty Correlation Chart
The statistical analysis conducted on geographies consisting of 421,778,178 people shows a moderate positive correlation between the proportion of Spanish and poverty level among males in the United States with a correlation coefficient (R) of 0.437 and weighted average of 11.7%. Similarly, the statistical analysis conducted on geographies consisting of 173,977,512 people shows a poor negative correlation between the proportion of Immigrants from Syria and poverty level among males in the United States with a correlation coefficient (R) of -0.108 and weighted average of 11.3%, a difference of 3.4%.
Male Poverty Correlation Summary
| Measurement | Spanish | Immigrants from Syria |
| Minimum | 1.2% | 2.5% |
| Maximum | 52.7% | 18.7% |
| Range | 51.5% | 16.2% |
| Mean | 17.1% | 10.2% |
| Median | 15.2% | 10.2% |
| Interquartile 25% (IQ1) | 11.3% | 7.6% |
| Interquartile 75% (IQ3) | 20.4% | 12.6% |
| Interquartile Range (IQR) | 9.1% | 5.0% |
| Standard Deviation (Sample) | 9.1% | 3.8% |
| Standard Deviation (Population) | 9.0% | 3.7% |
Demographics Similar to Spanish and Immigrants from Syria by Male Poverty
In terms of male poverty, the demographic groups most similar to Spanish are Iraqi (11.7%, a difference of 0.11%), Delaware (11.7%, a difference of 0.24%), Arab (11.6%, a difference of 0.31%), Hmong (11.6%, a difference of 0.31%), and Immigrants from Kenya (11.6%, a difference of 0.36%). Similarly, the demographic groups most similar to Immigrants from Syria are Immigrants from Morocco (11.3%, a difference of 0.010%), Immigrants from Costa Rica (11.3%, a difference of 0.080%), Mongolian (11.3%, a difference of 0.13%), Kenyan (11.3%, a difference of 0.19%), and Immigrants from South America (11.3%, a difference of 0.34%).
| Demographics | Rating | Rank | Male Poverty |
| Immigrants | Syria | 40.3 /100 | #179 | Average 11.3% |
| Immigrants | Morocco | 40.1 /100 | #180 | Average 11.3% |
| Immigrants | Costa Rica | 39.5 /100 | #181 | Fair 11.3% |
| Mongolians | 39.0 /100 | #182 | Fair 11.3% |
| Kenyans | 38.4 /100 | #183 | Fair 11.3% |
| Immigrants | South America | 36.9 /100 | #184 | Fair 11.3% |
| Immigrants | Afghanistan | 33.3 /100 | #185 | Fair 11.4% |
| Immigrants | Sierra Leone | 32.9 /100 | #186 | Fair 11.4% |
| Immigrants | Iraq | 31.9 /100 | #187 | Fair 11.4% |
| Sierra Leoneans | 29.9 /100 | #188 | Fair 11.4% |
| Hawaiians | 28.3 /100 | #189 | Fair 11.4% |
| Israelis | 26.1 /100 | #190 | Fair 11.5% |
| South American Indians | 22.8 /100 | #191 | Fair 11.5% |
| Immigrants | Uruguay | 19.1 /100 | #192 | Poor 11.6% |
| Immigrants | Kuwait | 17.3 /100 | #193 | Poor 11.6% |
| Immigrants | Kenya | 16.1 /100 | #194 | Poor 11.6% |
| Arabs | 15.8 /100 | #195 | Poor 11.6% |
| Hmong | 15.8 /100 | #196 | Poor 11.6% |
| Delaware | 15.4 /100 | #197 | Poor 11.7% |
| Iraqis | 14.7 /100 | #198 | Poor 11.7% |
| Spanish | 14.1 /100 | #199 | Poor 11.7% |