Spanish vs Immigrants from Eastern Europe Male Poverty
COMPARE
Spanish
Immigrants from Eastern Europe
Male Poverty
Male Poverty Comparison
Spanish
Immigrants from Eastern Europe
11.7%
MALE POVERTY
14.1/ 100
METRIC RATING
199th/ 347
METRIC RANK
10.2%
MALE POVERTY
96.9/ 100
METRIC RATING
74th/ 347
METRIC RANK
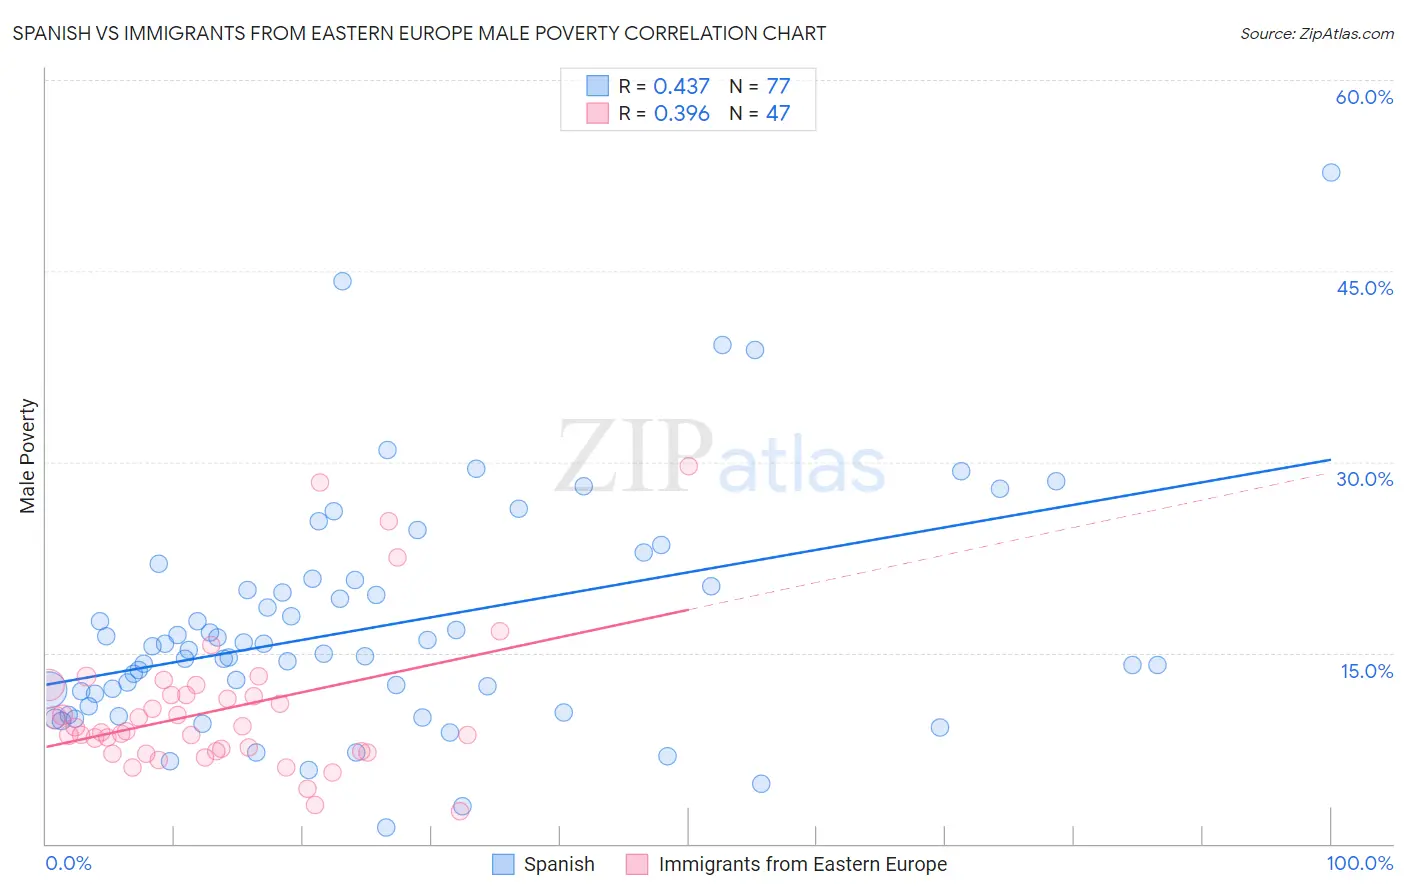
Spanish vs Immigrants from Eastern Europe Male Poverty Correlation Chart
The statistical analysis conducted on geographies consisting of 421,778,178 people shows a moderate positive correlation between the proportion of Spanish and poverty level among males in the United States with a correlation coefficient (R) of 0.437 and weighted average of 11.7%. Similarly, the statistical analysis conducted on geographies consisting of 475,131,955 people shows a mild positive correlation between the proportion of Immigrants from Eastern Europe and poverty level among males in the United States with a correlation coefficient (R) of 0.396 and weighted average of 10.2%, a difference of 14.0%.
Male Poverty Correlation Summary
| Measurement | Spanish | Immigrants from Eastern Europe |
| Minimum | 1.2% | 2.6% |
| Maximum | 52.7% | 29.6% |
| Range | 51.5% | 27.0% |
| Mean | 17.1% | 10.6% |
| Median | 15.2% | 8.8% |
| Interquartile 25% (IQ1) | 11.3% | 7.3% |
| Interquartile 75% (IQ3) | 20.4% | 11.7% |
| Interquartile Range (IQR) | 9.1% | 4.4% |
| Standard Deviation (Sample) | 9.1% | 5.7% |
| Standard Deviation (Population) | 9.0% | 5.7% |
Similar Demographics by Male Poverty
Demographics Similar to Spanish by Male Poverty
In terms of male poverty, the demographic groups most similar to Spanish are Immigrants from Lebanon (11.7%, a difference of 0.10%), Iraqi (11.7%, a difference of 0.11%), Spaniard (11.7%, a difference of 0.11%), Delaware (11.7%, a difference of 0.24%), and Arab (11.6%, a difference of 0.31%).
| Demographics | Rating | Rank | Male Poverty |
| Immigrants | Uruguay | 19.1 /100 | #192 | Poor 11.6% |
| Immigrants | Kuwait | 17.3 /100 | #193 | Poor 11.6% |
| Immigrants | Kenya | 16.1 /100 | #194 | Poor 11.6% |
| Arabs | 15.8 /100 | #195 | Poor 11.6% |
| Hmong | 15.8 /100 | #196 | Poor 11.6% |
| Delaware | 15.4 /100 | #197 | Poor 11.7% |
| Iraqis | 14.7 /100 | #198 | Poor 11.7% |
| Spanish | 14.1 /100 | #199 | Poor 11.7% |
| Immigrants | Lebanon | 13.6 /100 | #200 | Poor 11.7% |
| Spaniards | 13.5 /100 | #201 | Poor 11.7% |
| Aleuts | 10.4 /100 | #202 | Poor 11.8% |
| Immigrants | Western Asia | 9.8 /100 | #203 | Tragic 11.8% |
| Immigrants | Uganda | 8.5 /100 | #204 | Tragic 11.8% |
| Panamanians | 6.2 /100 | #205 | Tragic 11.9% |
| Immigrants | Eastern Africa | 5.4 /100 | #206 | Tragic 12.0% |
Demographics Similar to Immigrants from Eastern Europe by Male Poverty
In terms of male poverty, the demographic groups most similar to Immigrants from Eastern Europe are Carpatho Rusyn (10.2%, a difference of 0.0%), Dutch (10.2%, a difference of 0.010%), Immigrants from Belgium (10.3%, a difference of 0.040%), Immigrants from Asia (10.2%, a difference of 0.070%), and Irish (10.3%, a difference of 0.070%).
| Demographics | Rating | Rank | Male Poverty |
| Immigrants | Netherlands | 97.3 /100 | #67 | Exceptional 10.2% |
| Immigrants | Sri Lanka | 97.2 /100 | #68 | Exceptional 10.2% |
| Immigrants | Australia | 97.1 /100 | #69 | Exceptional 10.2% |
| Paraguayans | 97.1 /100 | #70 | Exceptional 10.2% |
| Europeans | 97.1 /100 | #71 | Exceptional 10.2% |
| Immigrants | Canada | 97.1 /100 | #72 | Exceptional 10.2% |
| Immigrants | Asia | 97.0 /100 | #73 | Exceptional 10.2% |
| Immigrants | Eastern Europe | 96.9 /100 | #74 | Exceptional 10.2% |
| Carpatho Rusyns | 96.9 /100 | #75 | Exceptional 10.2% |
| Dutch | 96.9 /100 | #76 | Exceptional 10.2% |
| Immigrants | Belgium | 96.8 /100 | #77 | Exceptional 10.3% |
| Irish | 96.8 /100 | #78 | Exceptional 10.3% |
| Immigrants | North America | 96.5 /100 | #79 | Exceptional 10.3% |
| English | 96.4 /100 | #80 | Exceptional 10.3% |
| Belgians | 95.9 /100 | #81 | Exceptional 10.3% |