Salvadoran vs German Male Poverty
COMPARE
Salvadoran
German
Male Poverty
Male Poverty Comparison
Salvadorans
Germans
12.6%
MALE POVERTY
0.6/ 100
METRIC RATING
231st/ 347
METRIC RANK
10.1%
MALE POVERTY
98.3/ 100
METRIC RATING
55th/ 347
METRIC RANK
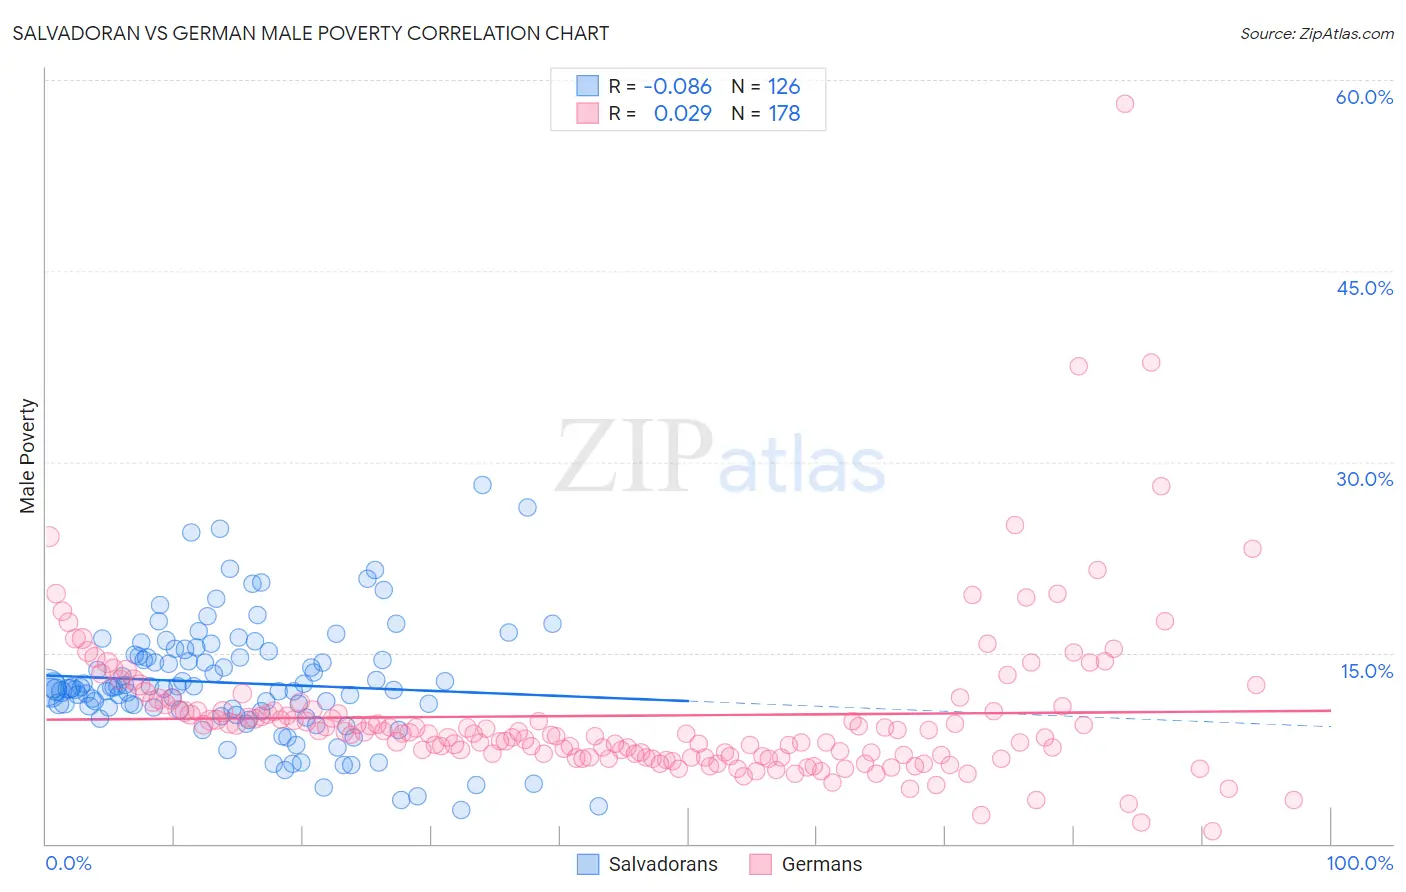
Salvadoran vs German Male Poverty Correlation Chart
The statistical analysis conducted on geographies consisting of 398,602,565 people shows a slight negative correlation between the proportion of Salvadorans and poverty level among males in the United States with a correlation coefficient (R) of -0.086 and weighted average of 12.6%. Similarly, the statistical analysis conducted on geographies consisting of 578,875,550 people shows no correlation between the proportion of Germans and poverty level among males in the United States with a correlation coefficient (R) of 0.029 and weighted average of 10.1%, a difference of 24.7%.
Male Poverty Correlation Summary
| Measurement | Salvadoran | German |
| Minimum | 2.6% | 1.0% |
| Maximum | 28.2% | 58.2% |
| Range | 25.5% | 57.2% |
| Mean | 12.6% | 10.1% |
| Median | 12.2% | 8.7% |
| Interquartile 25% (IQ1) | 10.5% | 6.9% |
| Interquartile 75% (IQ3) | 14.7% | 10.5% |
| Interquartile Range (IQR) | 4.2% | 3.7% |
| Standard Deviation (Sample) | 4.6% | 6.3% |
| Standard Deviation (Population) | 4.6% | 6.3% |
Similar Demographics by Male Poverty
Demographics Similar to Salvadorans by Male Poverty
In terms of male poverty, the demographic groups most similar to Salvadorans are Nicaraguan (12.6%, a difference of 0.12%), Fijian (12.6%, a difference of 0.16%), Immigrants from Armenia (12.6%, a difference of 0.23%), Marshallese (12.5%, a difference of 0.56%), and Immigrants from Laos (12.6%, a difference of 0.59%).
| Demographics | Rating | Rank | Male Poverty |
| Immigrants | Nigeria | 1.6 /100 | #224 | Tragic 12.3% |
| Osage | 1.5 /100 | #225 | Tragic 12.3% |
| Nigerians | 1.4 /100 | #226 | Tragic 12.3% |
| Alaska Natives | 1.4 /100 | #227 | Tragic 12.4% |
| Alsatians | 1.3 /100 | #228 | Tragic 12.4% |
| Cubans | 1.3 /100 | #229 | Tragic 12.4% |
| Marshallese | 0.8 /100 | #230 | Tragic 12.5% |
| Salvadorans | 0.6 /100 | #231 | Tragic 12.6% |
| Nicaraguans | 0.6 /100 | #232 | Tragic 12.6% |
| Fijians | 0.6 /100 | #233 | Tragic 12.6% |
| Immigrants | Armenia | 0.6 /100 | #234 | Tragic 12.6% |
| Immigrants | Laos | 0.5 /100 | #235 | Tragic 12.6% |
| Immigrants | Saudi Arabia | 0.4 /100 | #236 | Tragic 12.7% |
| French American Indians | 0.4 /100 | #237 | Tragic 12.7% |
| Ecuadorians | 0.4 /100 | #238 | Tragic 12.7% |
Demographics Similar to Germans by Male Poverty
In terms of male poverty, the demographic groups most similar to Germans are Immigrants from Bulgaria (10.1%, a difference of 0.21%), Immigrants from Austria (10.0%, a difference of 0.29%), Estonian (10.1%, a difference of 0.35%), Scandinavian (10.1%, a difference of 0.42%), and Immigrants from Europe (10.1%, a difference of 0.56%).
| Demographics | Rating | Rank | Male Poverty |
| Immigrants | Japan | 98.8 /100 | #48 | Exceptional 10.0% |
| Slovenes | 98.8 /100 | #49 | Exceptional 10.0% |
| Immigrants | Philippines | 98.7 /100 | #50 | Exceptional 10.0% |
| Immigrants | Croatia | 98.7 /100 | #51 | Exceptional 10.0% |
| Asians | 98.7 /100 | #52 | Exceptional 10.0% |
| Immigrants | Czechoslovakia | 98.6 /100 | #53 | Exceptional 10.0% |
| Immigrants | Austria | 98.5 /100 | #54 | Exceptional 10.0% |
| Germans | 98.3 /100 | #55 | Exceptional 10.1% |
| Immigrants | Bulgaria | 98.2 /100 | #56 | Exceptional 10.1% |
| Estonians | 98.1 /100 | #57 | Exceptional 10.1% |
| Scandinavians | 98.0 /100 | #58 | Exceptional 10.1% |
| Immigrants | Europe | 97.9 /100 | #59 | Exceptional 10.1% |
| Ukrainians | 97.9 /100 | #60 | Exceptional 10.1% |
| Austrians | 97.8 /100 | #61 | Exceptional 10.1% |
| Immigrants | Italy | 97.8 /100 | #62 | Exceptional 10.2% |