Spanish American vs Osage 11th Grade
COMPARE
Spanish American
Osage
11th Grade
11th Grade Comparison
Spanish Americans
Osage
91.4%
11TH GRADE
0.6/ 100
METRIC RATING
260th/ 347
METRIC RANK
92.7%
11TH GRADE
73.4/ 100
METRIC RATING
154th/ 347
METRIC RANK
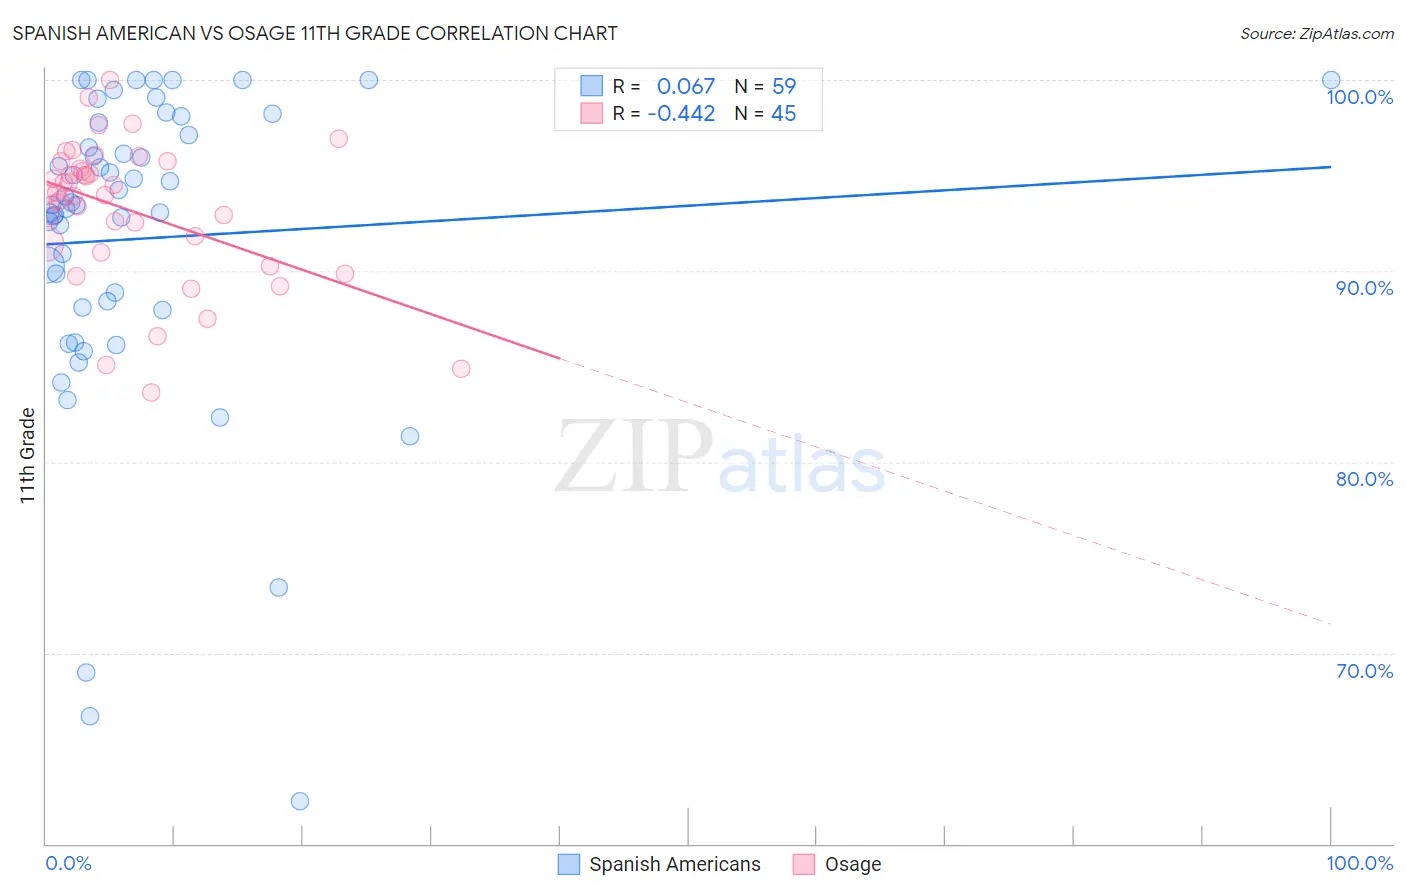
Spanish American vs Osage 11th Grade Correlation Chart
The statistical analysis conducted on geographies consisting of 103,168,542 people shows a slight positive correlation between the proportion of Spanish Americans and percentage of population with at least 11th grade education in the United States with a correlation coefficient (R) of 0.067 and weighted average of 91.4%. Similarly, the statistical analysis conducted on geographies consisting of 91,808,929 people shows a moderate negative correlation between the proportion of Osage and percentage of population with at least 11th grade education in the United States with a correlation coefficient (R) of -0.442 and weighted average of 92.7%, a difference of 1.5%.
11th Grade Correlation Summary
| Measurement | Spanish American | Osage |
| Minimum | 62.3% | 83.6% |
| Maximum | 100.0% | 100.0% |
| Range | 37.7% | 16.4% |
| Mean | 91.7% | 93.2% |
| Median | 93.5% | 94.1% |
| Interquartile 25% (IQ1) | 88.1% | 91.2% |
| Interquartile 75% (IQ3) | 97.8% | 95.5% |
| Interquartile Range (IQR) | 9.7% | 4.3% |
| Standard Deviation (Sample) | 8.3% | 3.7% |
| Standard Deviation (Population) | 8.2% | 3.6% |
Similar Demographics by 11th Grade
Demographics Similar to Spanish Americans by 11th Grade
In terms of 11th grade, the demographic groups most similar to Spanish Americans are Jamaican (91.4%, a difference of 0.010%), Taiwanese (91.3%, a difference of 0.010%), Immigrants from Colombia (91.4%, a difference of 0.020%), Immigrants from Uruguay (91.3%, a difference of 0.020%), and Cajun (91.4%, a difference of 0.040%).
| Demographics | Rating | Rank | 11th Grade |
| Immigrants | South America | 0.8 /100 | #253 | Tragic 91.4% |
| Immigrants | Eritrea | 0.7 /100 | #254 | Tragic 91.4% |
| Blacks/African Americans | 0.7 /100 | #255 | Tragic 91.4% |
| Immigrants | Senegal | 0.7 /100 | #256 | Tragic 91.4% |
| Cajuns | 0.7 /100 | #257 | Tragic 91.4% |
| Immigrants | Colombia | 0.6 /100 | #258 | Tragic 91.4% |
| Jamaicans | 0.6 /100 | #259 | Tragic 91.4% |
| Spanish Americans | 0.6 /100 | #260 | Tragic 91.4% |
| Taiwanese | 0.6 /100 | #261 | Tragic 91.3% |
| Immigrants | Uruguay | 0.5 /100 | #262 | Tragic 91.3% |
| Immigrants | Ghana | 0.3 /100 | #263 | Tragic 91.2% |
| Yup'ik | 0.3 /100 | #264 | Tragic 91.2% |
| Pueblo | 0.3 /100 | #265 | Tragic 91.2% |
| Immigrants | Western Africa | 0.3 /100 | #266 | Tragic 91.2% |
| Immigrants | Jamaica | 0.3 /100 | #267 | Tragic 91.2% |
Demographics Similar to Osage by 11th Grade
In terms of 11th grade, the demographic groups most similar to Osage are Argentinean (92.7%, a difference of 0.0%), Immigrants from Spain (92.7%, a difference of 0.0%), Potawatomi (92.8%, a difference of 0.010%), Iraqi (92.8%, a difference of 0.010%), and Brazilian (92.8%, a difference of 0.010%).
| Demographics | Rating | Rank | 11th Grade |
| Immigrants | Kenya | 78.7 /100 | #147 | Good 92.8% |
| Hmong | 78.6 /100 | #148 | Good 92.8% |
| Immigrants | Poland | 78.5 /100 | #149 | Good 92.8% |
| Immigrants | Egypt | 77.5 /100 | #150 | Good 92.8% |
| Potawatomi | 74.3 /100 | #151 | Good 92.8% |
| Iraqis | 74.2 /100 | #152 | Good 92.8% |
| Brazilians | 73.9 /100 | #153 | Good 92.8% |
| Osage | 73.4 /100 | #154 | Good 92.7% |
| Argentineans | 73.4 /100 | #155 | Good 92.7% |
| Immigrants | Spain | 73.0 /100 | #156 | Good 92.7% |
| Immigrants | Eastern Asia | 72.6 /100 | #157 | Good 92.7% |
| Immigrants | Venezuela | 72.0 /100 | #158 | Good 92.7% |
| Americans | 71.7 /100 | #159 | Good 92.7% |
| Immigrants | Lebanon | 70.7 /100 | #160 | Good 92.7% |
| Immigrants | Argentina | 69.8 /100 | #161 | Good 92.7% |