Spanish American vs English Female Poverty Among 25-34 Year Olds
COMPARE
Spanish American
English
Female Poverty Among 25-34 Year Olds
Female Poverty Among 25-34 Year Olds Comparison
Spanish Americans
English
16.7%
FEMALE POVERTY AMONG 25-34 YEAR OLDS
0.0/ 100
METRIC RATING
299th/ 347
METRIC RANK
13.9%
FEMALE POVERTY AMONG 25-34 YEAR OLDS
20.4/ 100
METRIC RATING
199th/ 347
METRIC RANK
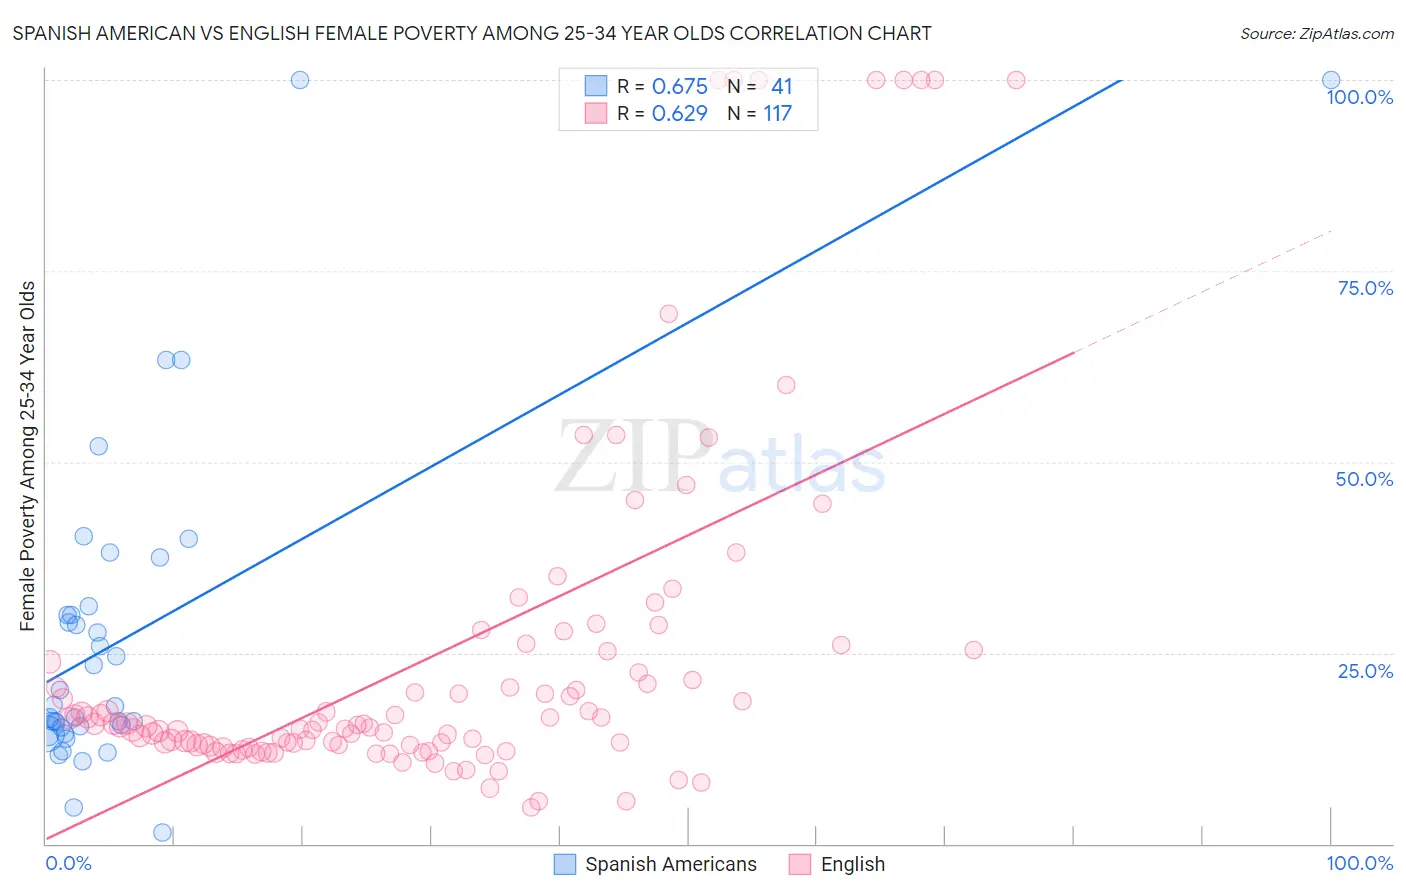
Spanish American vs English Female Poverty Among 25-34 Year Olds Correlation Chart
The statistical analysis conducted on geographies consisting of 102,935,839 people shows a significant positive correlation between the proportion of Spanish Americans and poverty level among females between the ages 25 and 34 in the United States with a correlation coefficient (R) of 0.675 and weighted average of 16.7%. Similarly, the statistical analysis conducted on geographies consisting of 554,696,556 people shows a significant positive correlation between the proportion of English and poverty level among females between the ages 25 and 34 in the United States with a correlation coefficient (R) of 0.629 and weighted average of 13.9%, a difference of 20.2%.
Female Poverty Among 25-34 Year Olds Correlation Summary
| Measurement | Spanish American | English |
| Minimum | 1.6% | 4.7% |
| Maximum | 100.0% | 100.0% |
| Range | 98.4% | 95.3% |
| Mean | 27.1% | 24.6% |
| Median | 17.9% | 15.6% |
| Interquartile 25% (IQ1) | 14.9% | 12.9% |
| Interquartile 75% (IQ3) | 30.6% | 24.5% |
| Interquartile Range (IQR) | 15.7% | 11.6% |
| Standard Deviation (Sample) | 21.7% | 23.4% |
| Standard Deviation (Population) | 21.4% | 23.3% |
Similar Demographics by Female Poverty Among 25-34 Year Olds
Demographics Similar to Spanish Americans by Female Poverty Among 25-34 Year Olds
In terms of female poverty among 25-34 year olds, the demographic groups most similar to Spanish Americans are Blackfeet (16.7%, a difference of 0.040%), U.S. Virgin Islander (16.7%, a difference of 0.15%), Immigrants from Congo (16.7%, a difference of 0.16%), Alaska Native (16.8%, a difference of 0.27%), and Immigrants from Guatemala (16.6%, a difference of 0.55%).
| Demographics | Rating | Rank | Female Poverty Among 25-34 Year Olds |
| Immigrants | Dominica | 0.0 /100 | #292 | Tragic 16.5% |
| Potawatomi | 0.0 /100 | #293 | Tragic 16.5% |
| Immigrants | Central America | 0.0 /100 | #294 | Tragic 16.6% |
| Mexicans | 0.0 /100 | #295 | Tragic 16.6% |
| Hispanics or Latinos | 0.0 /100 | #296 | Tragic 16.6% |
| Immigrants | Guatemala | 0.0 /100 | #297 | Tragic 16.6% |
| Blackfeet | 0.0 /100 | #298 | Tragic 16.7% |
| Spanish Americans | 0.0 /100 | #299 | Tragic 16.7% |
| U.S. Virgin Islanders | 0.0 /100 | #300 | Tragic 16.7% |
| Immigrants | Congo | 0.0 /100 | #301 | Tragic 16.7% |
| Alaska Natives | 0.0 /100 | #302 | Tragic 16.8% |
| Immigrants | Mexico | 0.0 /100 | #303 | Tragic 16.8% |
| Hondurans | 0.0 /100 | #304 | Tragic 16.9% |
| Immigrants | Cabo Verde | 0.0 /100 | #305 | Tragic 16.9% |
| Chickasaw | 0.0 /100 | #306 | Tragic 17.0% |
Demographics Similar to English by Female Poverty Among 25-34 Year Olds
In terms of female poverty among 25-34 year olds, the demographic groups most similar to English are Hmong (13.9%, a difference of 0.020%), Immigrants from Germany (13.9%, a difference of 0.060%), Immigrants from Saudi Arabia (13.9%, a difference of 0.18%), Immigrants from Trinidad and Tobago (14.0%, a difference of 0.37%), and Scottish (13.9%, a difference of 0.38%).
| Demographics | Rating | Rank | Female Poverty Among 25-34 Year Olds |
| Tlingit-Haida | 28.1 /100 | #192 | Fair 13.8% |
| Immigrants | Kenya | 28.0 /100 | #193 | Fair 13.8% |
| Moroccans | 25.1 /100 | #194 | Fair 13.8% |
| Immigrants | Cambodia | 24.0 /100 | #195 | Fair 13.9% |
| Scottish | 23.6 /100 | #196 | Fair 13.9% |
| Immigrants | Saudi Arabia | 21.9 /100 | #197 | Fair 13.9% |
| Immigrants | Germany | 20.9 /100 | #198 | Fair 13.9% |
| English | 20.4 /100 | #199 | Fair 13.9% |
| Hmong | 20.3 /100 | #200 | Fair 13.9% |
| Immigrants | Trinidad and Tobago | 17.6 /100 | #201 | Poor 14.0% |
| Welsh | 17.2 /100 | #202 | Poor 14.0% |
| Immigrants | Immigrants | 14.5 /100 | #203 | Poor 14.0% |
| Hawaiians | 13.6 /100 | #204 | Poor 14.1% |
| Immigrants | Africa | 13.4 /100 | #205 | Poor 14.1% |
| Hungarians | 11.8 /100 | #206 | Poor 14.1% |