Italian vs English Female Poverty Among 25-34 Year Olds
COMPARE
Italian
English
Female Poverty Among 25-34 Year Olds
Female Poverty Among 25-34 Year Olds Comparison
Italians
English
12.5%
FEMALE POVERTY AMONG 25-34 YEAR OLDS
97.2/ 100
METRIC RATING
89th/ 347
METRIC RANK
13.9%
FEMALE POVERTY AMONG 25-34 YEAR OLDS
20.4/ 100
METRIC RATING
199th/ 347
METRIC RANK
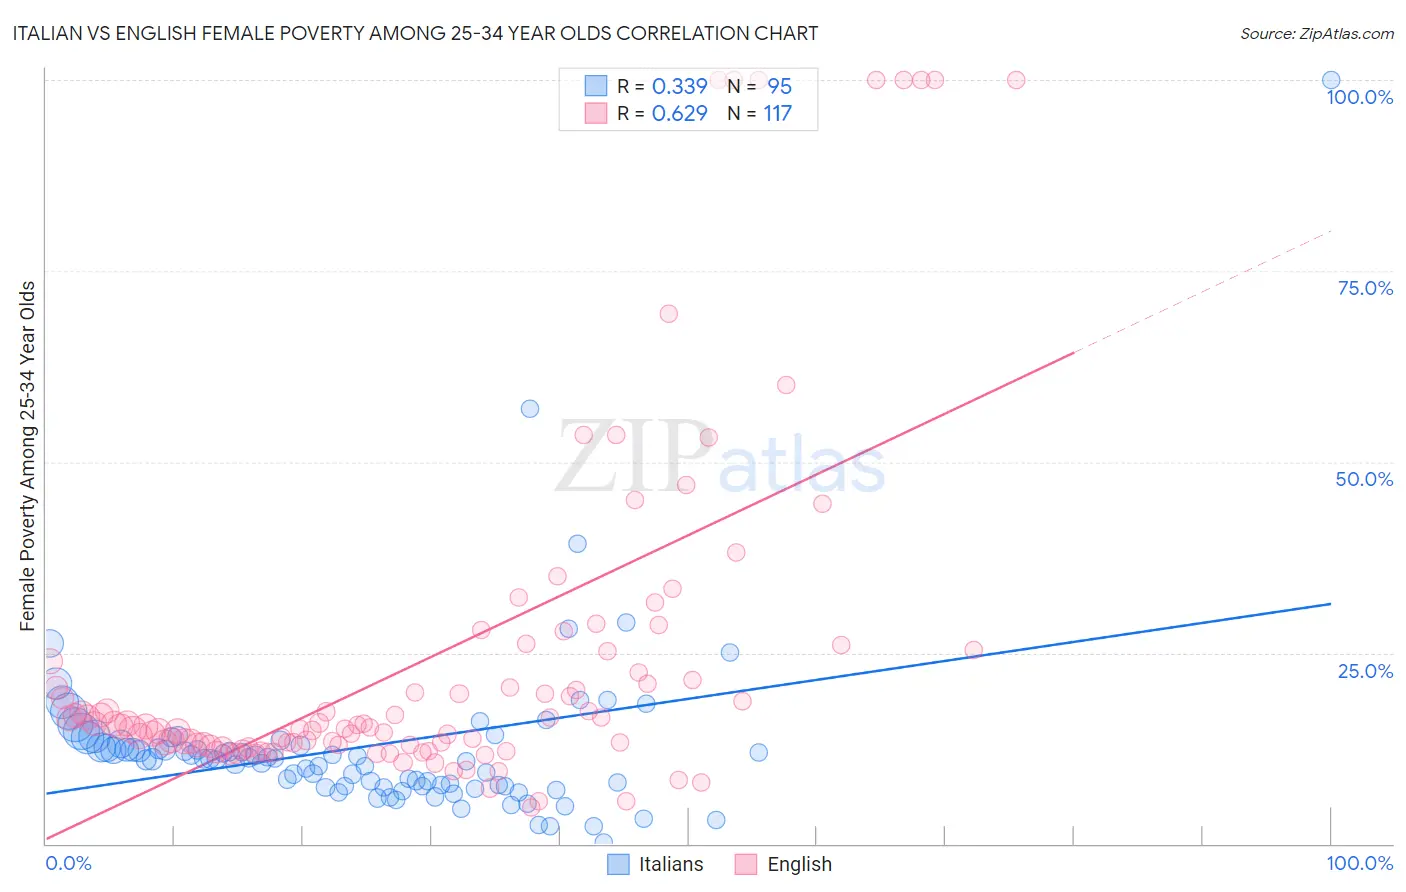
Italian vs English Female Poverty Among 25-34 Year Olds Correlation Chart
The statistical analysis conducted on geographies consisting of 551,961,209 people shows a mild positive correlation between the proportion of Italians and poverty level among females between the ages 25 and 34 in the United States with a correlation coefficient (R) of 0.339 and weighted average of 12.5%. Similarly, the statistical analysis conducted on geographies consisting of 554,696,556 people shows a significant positive correlation between the proportion of English and poverty level among females between the ages 25 and 34 in the United States with a correlation coefficient (R) of 0.629 and weighted average of 13.9%, a difference of 11.1%.
Female Poverty Among 25-34 Year Olds Correlation Summary
| Measurement | Italian | English |
| Minimum | 0.18% | 4.7% |
| Maximum | 100.0% | 100.0% |
| Range | 99.8% | 95.3% |
| Mean | 12.7% | 24.6% |
| Median | 11.1% | 15.6% |
| Interquartile 25% (IQ1) | 7.5% | 12.9% |
| Interquartile 75% (IQ3) | 13.1% | 24.5% |
| Interquartile Range (IQR) | 5.5% | 11.6% |
| Standard Deviation (Sample) | 11.8% | 23.4% |
| Standard Deviation (Population) | 11.8% | 23.3% |
Similar Demographics by Female Poverty Among 25-34 Year Olds
Demographics Similar to Italians by Female Poverty Among 25-34 Year Olds
In terms of female poverty among 25-34 year olds, the demographic groups most similar to Italians are Immigrants from Albania (12.5%, a difference of 0.15%), Immigrants from Austria (12.5%, a difference of 0.17%), Argentinean (12.5%, a difference of 0.24%), Norwegian (12.6%, a difference of 0.25%), and Croatian (12.5%, a difference of 0.27%).
| Demographics | Rating | Rank | Female Poverty Among 25-34 Year Olds |
| Ethiopians | 98.0 /100 | #82 | Exceptional 12.4% |
| Albanians | 97.7 /100 | #83 | Exceptional 12.5% |
| Immigrants | Latvia | 97.7 /100 | #84 | Exceptional 12.5% |
| Immigrants | South Eastern Asia | 97.6 /100 | #85 | Exceptional 12.5% |
| Croatians | 97.5 /100 | #86 | Exceptional 12.5% |
| Argentineans | 97.5 /100 | #87 | Exceptional 12.5% |
| Immigrants | Austria | 97.4 /100 | #88 | Exceptional 12.5% |
| Italians | 97.2 /100 | #89 | Exceptional 12.5% |
| Immigrants | Albania | 97.1 /100 | #90 | Exceptional 12.5% |
| Norwegians | 96.9 /100 | #91 | Exceptional 12.6% |
| Immigrants | Armenia | 96.9 /100 | #92 | Exceptional 12.6% |
| Palestinians | 96.9 /100 | #93 | Exceptional 12.6% |
| Immigrants | France | 96.8 /100 | #94 | Exceptional 12.6% |
| Ukrainians | 96.7 /100 | #95 | Exceptional 12.6% |
| Immigrants | Zimbabwe | 96.7 /100 | #96 | Exceptional 12.6% |
Demographics Similar to English by Female Poverty Among 25-34 Year Olds
In terms of female poverty among 25-34 year olds, the demographic groups most similar to English are Hmong (13.9%, a difference of 0.020%), Immigrants from Germany (13.9%, a difference of 0.060%), Immigrants from Saudi Arabia (13.9%, a difference of 0.18%), Immigrants from Trinidad and Tobago (14.0%, a difference of 0.37%), and Scottish (13.9%, a difference of 0.38%).
| Demographics | Rating | Rank | Female Poverty Among 25-34 Year Olds |
| Tlingit-Haida | 28.1 /100 | #192 | Fair 13.8% |
| Immigrants | Kenya | 28.0 /100 | #193 | Fair 13.8% |
| Moroccans | 25.1 /100 | #194 | Fair 13.8% |
| Immigrants | Cambodia | 24.0 /100 | #195 | Fair 13.9% |
| Scottish | 23.6 /100 | #196 | Fair 13.9% |
| Immigrants | Saudi Arabia | 21.9 /100 | #197 | Fair 13.9% |
| Immigrants | Germany | 20.9 /100 | #198 | Fair 13.9% |
| English | 20.4 /100 | #199 | Fair 13.9% |
| Hmong | 20.3 /100 | #200 | Fair 13.9% |
| Immigrants | Trinidad and Tobago | 17.6 /100 | #201 | Poor 14.0% |
| Welsh | 17.2 /100 | #202 | Poor 14.0% |
| Immigrants | Immigrants | 14.5 /100 | #203 | Poor 14.0% |
| Hawaiians | 13.6 /100 | #204 | Poor 14.1% |
| Immigrants | Africa | 13.4 /100 | #205 | Poor 14.1% |
| Hungarians | 11.8 /100 | #206 | Poor 14.1% |