Jamaican vs English Female Poverty Among 25-34 Year Olds
COMPARE
Jamaican
English
Female Poverty Among 25-34 Year Olds
Female Poverty Among 25-34 Year Olds Comparison
Jamaicans
English
14.8%
FEMALE POVERTY AMONG 25-34 YEAR OLDS
1.0/ 100
METRIC RATING
246th/ 347
METRIC RANK
13.9%
FEMALE POVERTY AMONG 25-34 YEAR OLDS
20.4/ 100
METRIC RATING
199th/ 347
METRIC RANK
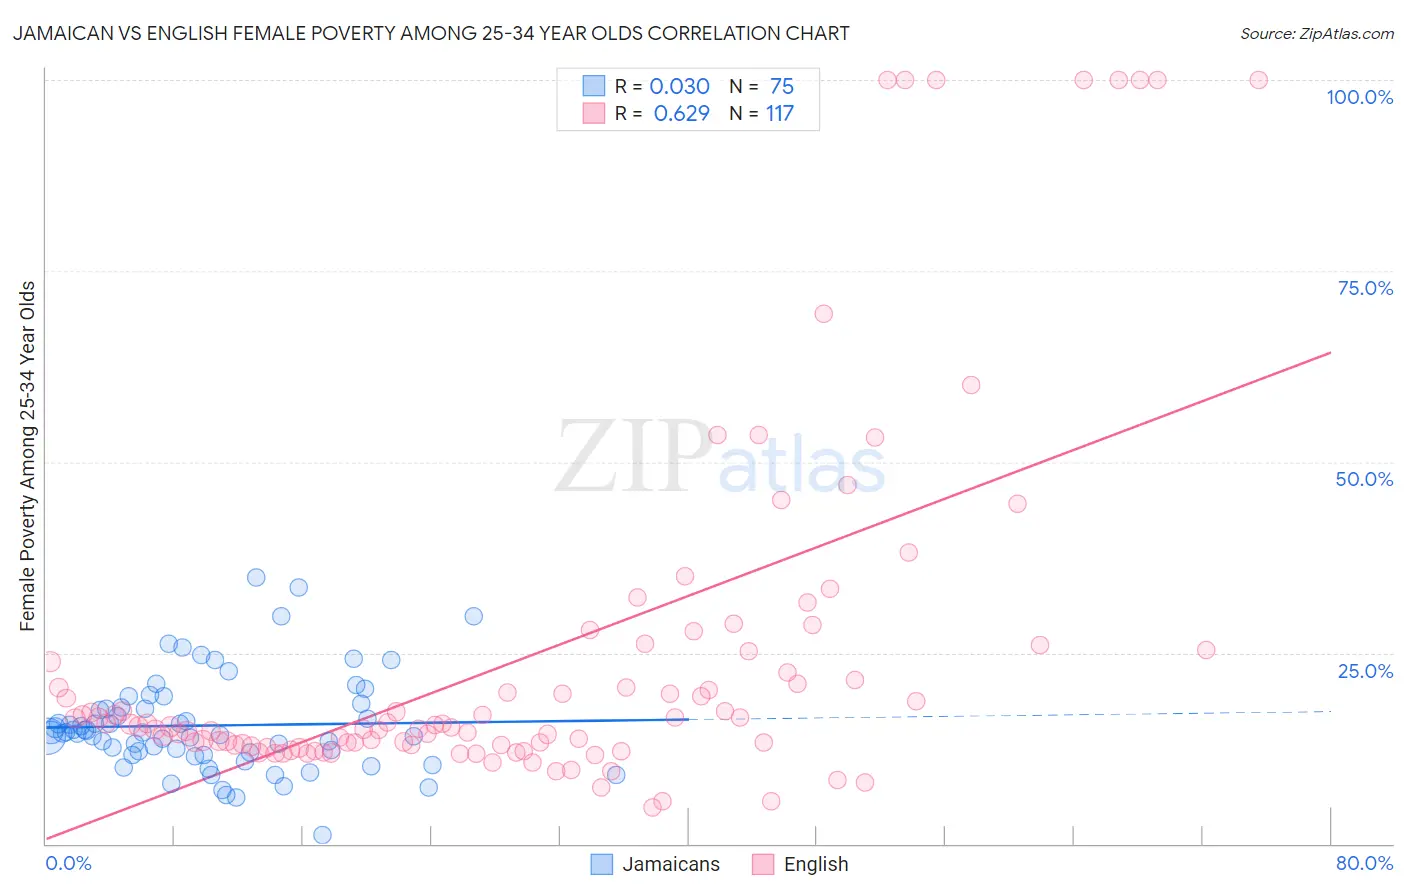
Jamaican vs English Female Poverty Among 25-34 Year Olds Correlation Chart
The statistical analysis conducted on geographies consisting of 363,151,560 people shows no correlation between the proportion of Jamaicans and poverty level among females between the ages 25 and 34 in the United States with a correlation coefficient (R) of 0.030 and weighted average of 14.8%. Similarly, the statistical analysis conducted on geographies consisting of 554,696,556 people shows a significant positive correlation between the proportion of English and poverty level among females between the ages 25 and 34 in the United States with a correlation coefficient (R) of 0.629 and weighted average of 13.9%, a difference of 6.5%.
Female Poverty Among 25-34 Year Olds Correlation Summary
| Measurement | Jamaican | English |
| Minimum | 1.1% | 4.7% |
| Maximum | 34.8% | 100.0% |
| Range | 33.7% | 95.3% |
| Mean | 15.5% | 24.6% |
| Median | 14.5% | 15.6% |
| Interquartile 25% (IQ1) | 11.6% | 12.9% |
| Interquartile 75% (IQ3) | 17.9% | 24.5% |
| Interquartile Range (IQR) | 6.3% | 11.6% |
| Standard Deviation (Sample) | 6.3% | 23.4% |
| Standard Deviation (Population) | 6.2% | 23.3% |
Similar Demographics by Female Poverty Among 25-34 Year Olds
Demographics Similar to Jamaicans by Female Poverty Among 25-34 Year Olds
In terms of female poverty among 25-34 year olds, the demographic groups most similar to Jamaicans are Immigrants from Middle Africa (14.8%, a difference of 0.040%), Immigrants from Nicaragua (14.8%, a difference of 0.22%), Immigrants from Bangladesh (14.8%, a difference of 0.22%), Scotch-Irish (14.8%, a difference of 0.26%), and Barbadian (14.8%, a difference of 0.26%).
| Demographics | Rating | Rank | Female Poverty Among 25-34 Year Olds |
| Malaysians | 1.4 /100 | #239 | Tragic 14.7% |
| Immigrants | Grenada | 1.3 /100 | #240 | Tragic 14.7% |
| Scotch-Irish | 1.2 /100 | #241 | Tragic 14.8% |
| Barbadians | 1.2 /100 | #242 | Tragic 14.8% |
| Immigrants | Nicaragua | 1.1 /100 | #243 | Tragic 14.8% |
| Immigrants | Bangladesh | 1.1 /100 | #244 | Tragic 14.8% |
| Immigrants | Middle Africa | 1.0 /100 | #245 | Tragic 14.8% |
| Jamaicans | 1.0 /100 | #246 | Tragic 14.8% |
| German Russians | 0.8 /100 | #247 | Tragic 14.9% |
| Immigrants | Western Africa | 0.8 /100 | #248 | Tragic 14.9% |
| Immigrants | Haiti | 0.5 /100 | #249 | Tragic 15.0% |
| Immigrants | El Salvador | 0.5 /100 | #250 | Tragic 15.0% |
| Haitians | 0.5 /100 | #251 | Tragic 15.0% |
| Belizeans | 0.4 /100 | #252 | Tragic 15.1% |
| Immigrants | West Indies | 0.4 /100 | #253 | Tragic 15.1% |
Demographics Similar to English by Female Poverty Among 25-34 Year Olds
In terms of female poverty among 25-34 year olds, the demographic groups most similar to English are Hmong (13.9%, a difference of 0.020%), Immigrants from Germany (13.9%, a difference of 0.060%), Immigrants from Saudi Arabia (13.9%, a difference of 0.18%), Immigrants from Trinidad and Tobago (14.0%, a difference of 0.37%), and Scottish (13.9%, a difference of 0.38%).
| Demographics | Rating | Rank | Female Poverty Among 25-34 Year Olds |
| Tlingit-Haida | 28.1 /100 | #192 | Fair 13.8% |
| Immigrants | Kenya | 28.0 /100 | #193 | Fair 13.8% |
| Moroccans | 25.1 /100 | #194 | Fair 13.8% |
| Immigrants | Cambodia | 24.0 /100 | #195 | Fair 13.9% |
| Scottish | 23.6 /100 | #196 | Fair 13.9% |
| Immigrants | Saudi Arabia | 21.9 /100 | #197 | Fair 13.9% |
| Immigrants | Germany | 20.9 /100 | #198 | Fair 13.9% |
| English | 20.4 /100 | #199 | Fair 13.9% |
| Hmong | 20.3 /100 | #200 | Fair 13.9% |
| Immigrants | Trinidad and Tobago | 17.6 /100 | #201 | Poor 14.0% |
| Welsh | 17.2 /100 | #202 | Poor 14.0% |
| Immigrants | Immigrants | 14.5 /100 | #203 | Poor 14.0% |
| Hawaiians | 13.6 /100 | #204 | Poor 14.1% |
| Immigrants | Africa | 13.4 /100 | #205 | Poor 14.1% |
| Hungarians | 11.8 /100 | #206 | Poor 14.1% |