Spanish American vs Pennsylvania German Female Poverty Among 25-34 Year Olds
COMPARE
Spanish American
Pennsylvania German
Female Poverty Among 25-34 Year Olds
Female Poverty Among 25-34 Year Olds Comparison
Spanish Americans
Pennsylvania Germans
16.7%
FEMALE POVERTY AMONG 25-34 YEAR OLDS
0.0/ 100
METRIC RATING
299th/ 347
METRIC RANK
15.4%
FEMALE POVERTY AMONG 25-34 YEAR OLDS
0.1/ 100
METRIC RATING
264th/ 347
METRIC RANK
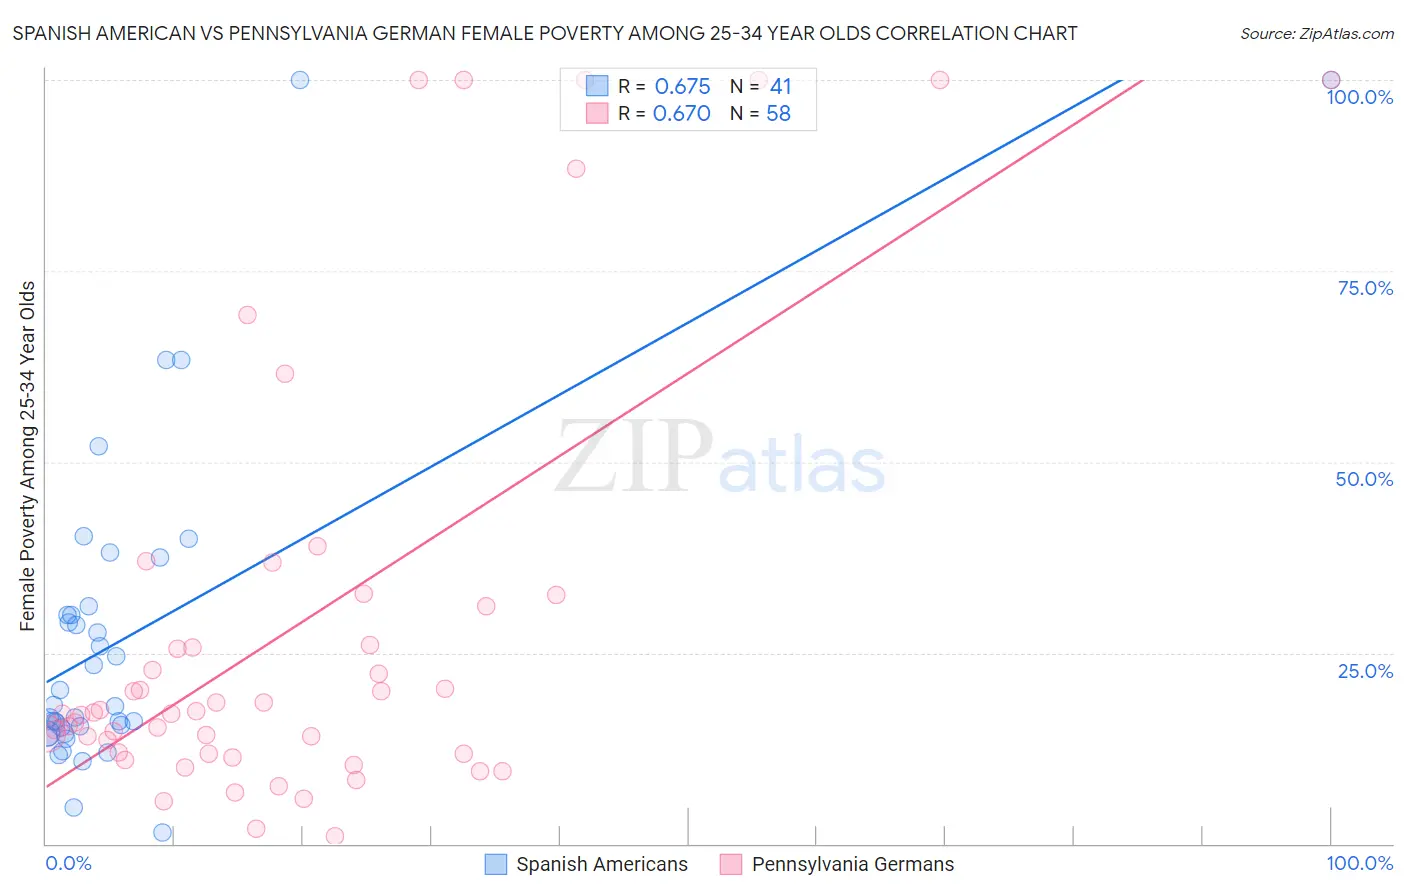
Spanish American vs Pennsylvania German Female Poverty Among 25-34 Year Olds Correlation Chart
The statistical analysis conducted on geographies consisting of 102,935,839 people shows a significant positive correlation between the proportion of Spanish Americans and poverty level among females between the ages 25 and 34 in the United States with a correlation coefficient (R) of 0.675 and weighted average of 16.7%. Similarly, the statistical analysis conducted on geographies consisting of 230,552,403 people shows a significant positive correlation between the proportion of Pennsylvania Germans and poverty level among females between the ages 25 and 34 in the United States with a correlation coefficient (R) of 0.670 and weighted average of 15.4%, a difference of 8.4%.
Female Poverty Among 25-34 Year Olds Correlation Summary
| Measurement | Spanish American | Pennsylvania German |
| Minimum | 1.6% | 1.0% |
| Maximum | 100.0% | 100.0% |
| Range | 98.4% | 99.0% |
| Mean | 27.1% | 28.5% |
| Median | 17.9% | 17.1% |
| Interquartile 25% (IQ1) | 14.9% | 11.8% |
| Interquartile 75% (IQ3) | 30.6% | 31.1% |
| Interquartile Range (IQR) | 15.7% | 19.3% |
| Standard Deviation (Sample) | 21.7% | 28.8% |
| Standard Deviation (Population) | 21.4% | 28.5% |
Similar Demographics by Female Poverty Among 25-34 Year Olds
Demographics Similar to Spanish Americans by Female Poverty Among 25-34 Year Olds
In terms of female poverty among 25-34 year olds, the demographic groups most similar to Spanish Americans are Blackfeet (16.7%, a difference of 0.040%), U.S. Virgin Islander (16.7%, a difference of 0.15%), Immigrants from Congo (16.7%, a difference of 0.16%), Alaska Native (16.8%, a difference of 0.27%), and Immigrants from Guatemala (16.6%, a difference of 0.55%).
| Demographics | Rating | Rank | Female Poverty Among 25-34 Year Olds |
| Immigrants | Dominica | 0.0 /100 | #292 | Tragic 16.5% |
| Potawatomi | 0.0 /100 | #293 | Tragic 16.5% |
| Immigrants | Central America | 0.0 /100 | #294 | Tragic 16.6% |
| Mexicans | 0.0 /100 | #295 | Tragic 16.6% |
| Hispanics or Latinos | 0.0 /100 | #296 | Tragic 16.6% |
| Immigrants | Guatemala | 0.0 /100 | #297 | Tragic 16.6% |
| Blackfeet | 0.0 /100 | #298 | Tragic 16.7% |
| Spanish Americans | 0.0 /100 | #299 | Tragic 16.7% |
| U.S. Virgin Islanders | 0.0 /100 | #300 | Tragic 16.7% |
| Immigrants | Congo | 0.0 /100 | #301 | Tragic 16.7% |
| Alaska Natives | 0.0 /100 | #302 | Tragic 16.8% |
| Immigrants | Mexico | 0.0 /100 | #303 | Tragic 16.8% |
| Hondurans | 0.0 /100 | #304 | Tragic 16.9% |
| Immigrants | Cabo Verde | 0.0 /100 | #305 | Tragic 16.9% |
| Chickasaw | 0.0 /100 | #306 | Tragic 17.0% |
Demographics Similar to Pennsylvania Germans by Female Poverty Among 25-34 Year Olds
In terms of female poverty among 25-34 year olds, the demographic groups most similar to Pennsylvania Germans are Immigrants from Liberia (15.4%, a difference of 0.030%), Immigrants from Somalia (15.4%, a difference of 0.040%), Central American (15.5%, a difference of 0.42%), Mexican American Indian (15.4%, a difference of 0.43%), and Immigrants from Belize (15.3%, a difference of 0.68%).
| Demographics | Rating | Rank | Female Poverty Among 25-34 Year Olds |
| Immigrants | Burma/Myanmar | 0.3 /100 | #257 | Tragic 15.2% |
| Nepalese | 0.2 /100 | #258 | Tragic 15.2% |
| Immigrants | Cuba | 0.2 /100 | #259 | Tragic 15.2% |
| Marshallese | 0.2 /100 | #260 | Tragic 15.3% |
| Liberians | 0.2 /100 | #261 | Tragic 15.3% |
| Immigrants | Belize | 0.2 /100 | #262 | Tragic 15.3% |
| Mexican American Indians | 0.2 /100 | #263 | Tragic 15.4% |
| Pennsylvania Germans | 0.1 /100 | #264 | Tragic 15.4% |
| Immigrants | Liberia | 0.1 /100 | #265 | Tragic 15.4% |
| Immigrants | Somalia | 0.1 /100 | #266 | Tragic 15.4% |
| Central Americans | 0.1 /100 | #267 | Tragic 15.5% |
| Immigrants | Senegal | 0.1 /100 | #268 | Tragic 15.6% |
| Sub-Saharan Africans | 0.1 /100 | #269 | Tragic 15.6% |
| British West Indians | 0.1 /100 | #270 | Tragic 15.6% |
| Cree | 0.1 /100 | #271 | Tragic 15.6% |