Bermudan vs Immigrants from Japan Child Poverty Under the Age of 5
COMPARE
Bermudan
Immigrants from Japan
Child Poverty Under the Age of 5
Child Poverty Under the Age of 5 Comparison
Bermudans
Immigrants from Japan
19.2%
CHILD POVERTY UNDER THE AGE OF 5
1.2/ 100
METRIC RATING
231st/ 347
METRIC RANK
13.8%
CHILD POVERTY UNDER THE AGE OF 5
100.0/ 100
METRIC RATING
20th/ 347
METRIC RANK
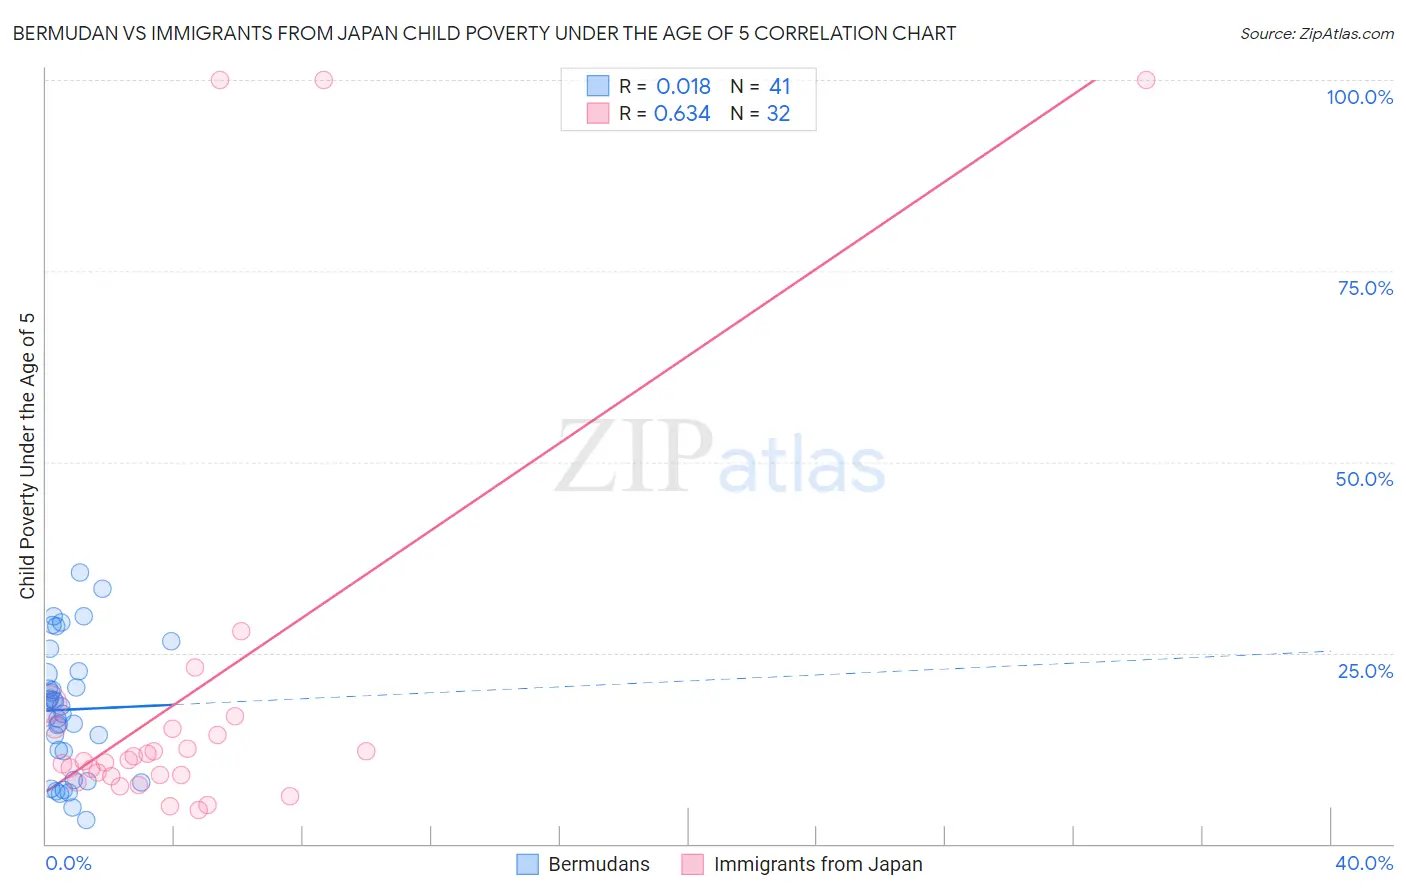
Bermudan vs Immigrants from Japan Child Poverty Under the Age of 5 Correlation Chart
The statistical analysis conducted on geographies consisting of 55,495,700 people shows no correlation between the proportion of Bermudans and poverty level among children under the age of 5 in the United States with a correlation coefficient (R) of 0.018 and weighted average of 19.2%. Similarly, the statistical analysis conducted on geographies consisting of 328,132,973 people shows a significant positive correlation between the proportion of Immigrants from Japan and poverty level among children under the age of 5 in the United States with a correlation coefficient (R) of 0.634 and weighted average of 13.8%, a difference of 39.4%.
Child Poverty Under the Age of 5 Correlation Summary
| Measurement | Bermudan | Immigrants from Japan |
| Minimum | 3.2% | 4.4% |
| Maximum | 35.5% | 100.0% |
| Range | 32.4% | 95.6% |
| Mean | 17.6% | 19.8% |
| Median | 18.0% | 10.9% |
| Interquartile 25% (IQ1) | 10.2% | 8.9% |
| Interquartile 75% (IQ3) | 22.4% | 15.1% |
| Interquartile Range (IQR) | 12.2% | 6.2% |
| Standard Deviation (Sample) | 8.3% | 26.7% |
| Standard Deviation (Population) | 8.2% | 26.2% |
Similar Demographics by Child Poverty Under the Age of 5
Demographics Similar to Bermudans by Child Poverty Under the Age of 5
In terms of child poverty under the age of 5, the demographic groups most similar to Bermudans are Ecuadorian (19.2%, a difference of 0.050%), Ghanaian (19.2%, a difference of 0.090%), Immigrants from Sudan (19.2%, a difference of 0.17%), Cape Verdean (19.1%, a difference of 0.48%), and Trinidadian and Tobagonian (19.3%, a difference of 0.56%).
| Demographics | Rating | Rank | Child Poverty Under the Age of 5 |
| Nicaraguans | 1.6 /100 | #224 | Tragic 19.1% |
| Nigerians | 1.6 /100 | #225 | Tragic 19.1% |
| Immigrants | Eritrea | 1.5 /100 | #226 | Tragic 19.1% |
| Cape Verdeans | 1.4 /100 | #227 | Tragic 19.1% |
| Immigrants | Sudan | 1.3 /100 | #228 | Tragic 19.2% |
| Ghanaians | 1.2 /100 | #229 | Tragic 19.2% |
| Ecuadorians | 1.2 /100 | #230 | Tragic 19.2% |
| Bermudans | 1.2 /100 | #231 | Tragic 19.2% |
| Trinidadians and Tobagonians | 0.9 /100 | #232 | Tragic 19.3% |
| Sudanese | 0.9 /100 | #233 | Tragic 19.3% |
| Immigrants | Micronesia | 0.9 /100 | #234 | Tragic 19.4% |
| Immigrants | Laos | 0.8 /100 | #235 | Tragic 19.4% |
| Immigrants | Trinidad and Tobago | 0.8 /100 | #236 | Tragic 19.4% |
| Immigrants | Cabo Verde | 0.6 /100 | #237 | Tragic 19.5% |
| Salvadorans | 0.6 /100 | #238 | Tragic 19.5% |
Demographics Similar to Immigrants from Japan by Child Poverty Under the Age of 5
In terms of child poverty under the age of 5, the demographic groups most similar to Immigrants from Japan are Bolivian (13.8%, a difference of 0.30%), Immigrants from Bolivia (13.8%, a difference of 0.38%), Immigrants from Ireland (13.7%, a difference of 0.40%), Bulgarian (13.9%, a difference of 0.82%), and Immigrants from China (13.6%, a difference of 1.3%).
| Demographics | Rating | Rank | Child Poverty Under the Age of 5 |
| Bhutanese | 100.0 /100 | #13 | Exceptional 13.4% |
| Okinawans | 100.0 /100 | #14 | Exceptional 13.4% |
| Indians (Asian) | 100.0 /100 | #15 | Exceptional 13.4% |
| Immigrants | Eastern Asia | 100.0 /100 | #16 | Exceptional 13.5% |
| Assyrians/Chaldeans/Syriacs | 100.0 /100 | #17 | Exceptional 13.6% |
| Immigrants | China | 100.0 /100 | #18 | Exceptional 13.6% |
| Immigrants | Ireland | 100.0 /100 | #19 | Exceptional 13.7% |
| Immigrants | Japan | 100.0 /100 | #20 | Exceptional 13.8% |
| Bolivians | 100.0 /100 | #21 | Exceptional 13.8% |
| Immigrants | Bolivia | 100.0 /100 | #22 | Exceptional 13.8% |
| Bulgarians | 99.9 /100 | #23 | Exceptional 13.9% |
| Asians | 99.9 /100 | #24 | Exceptional 14.0% |
| Cypriots | 99.9 /100 | #25 | Exceptional 14.0% |
| Immigrants | Lithuania | 99.9 /100 | #26 | Exceptional 14.1% |
| Tongans | 99.9 /100 | #27 | Exceptional 14.2% |