Spanish American Indian vs Central American Seniors Poverty Over the Age of 75
COMPARE
Spanish American Indian
Central American
Seniors Poverty Over the Age of 75
Seniors Poverty Over the Age of 75 Comparison
Spanish American Indians
Central Americans
15.5%
SENIORS POVERTY OVER THE AGE OF 75
0.0/ 100
METRIC RATING
299th/ 347
METRIC RANK
14.7%
SENIORS POVERTY OVER THE AGE OF 75
0.0/ 100
METRIC RATING
280th/ 347
METRIC RANK
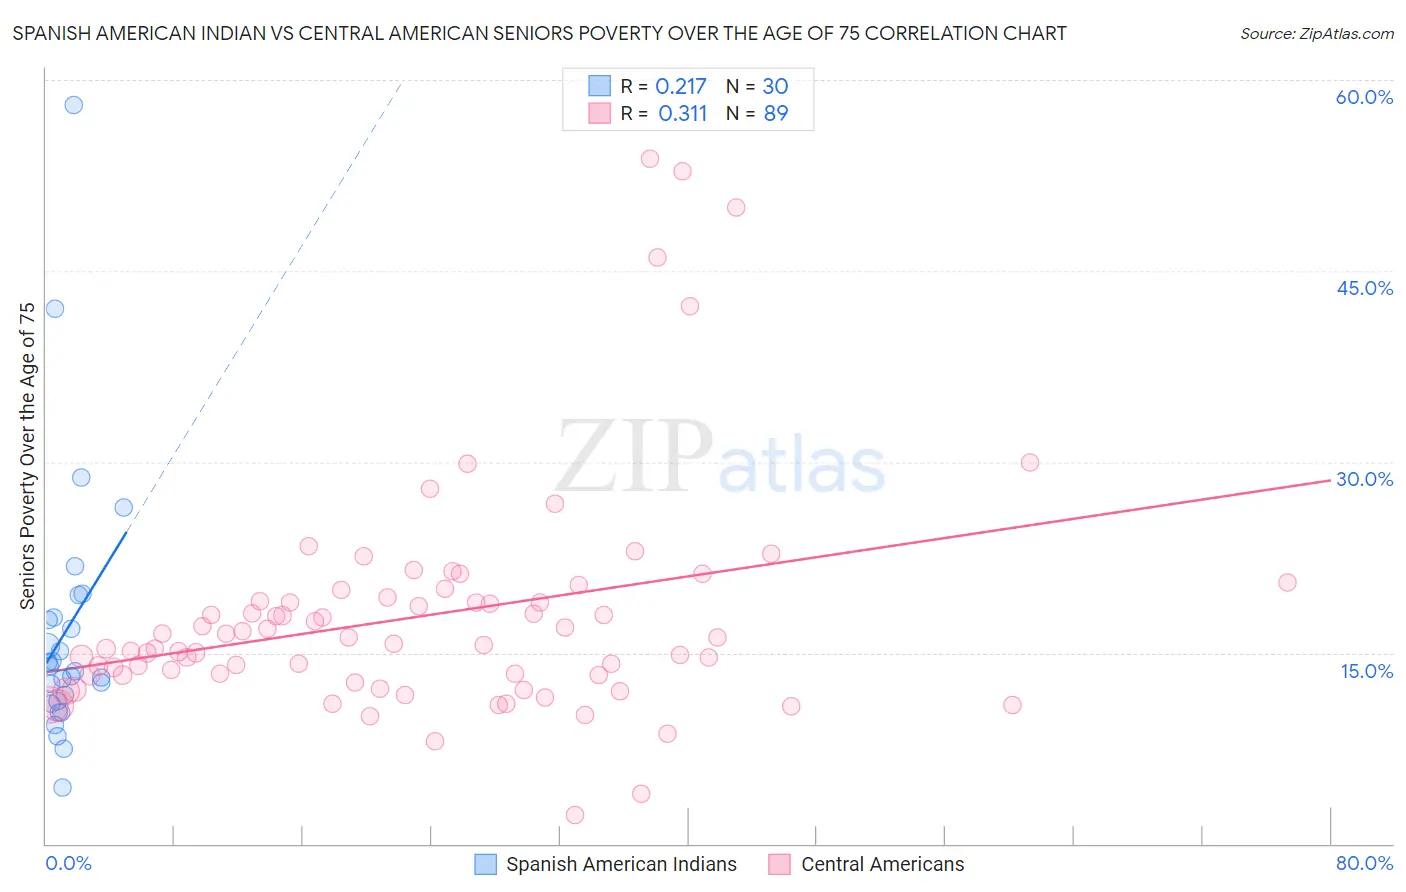
Spanish American Indian vs Central American Seniors Poverty Over the Age of 75 Correlation Chart
The statistical analysis conducted on geographies consisting of 73,033,240 people shows a weak positive correlation between the proportion of Spanish American Indians and poverty level among seniors over the age of 75 in the United States with a correlation coefficient (R) of 0.217 and weighted average of 15.5%. Similarly, the statistical analysis conducted on geographies consisting of 495,711,598 people shows a mild positive correlation between the proportion of Central Americans and poverty level among seniors over the age of 75 in the United States with a correlation coefficient (R) of 0.311 and weighted average of 14.7%, a difference of 5.2%.
Seniors Poverty Over the Age of 75 Correlation Summary
| Measurement | Spanish American Indian | Central American |
| Minimum | 4.4% | 2.3% |
| Maximum | 58.0% | 53.8% |
| Range | 53.6% | 51.5% |
| Mean | 16.8% | 17.8% |
| Median | 13.8% | 15.7% |
| Interquartile 25% (IQ1) | 11.2% | 13.2% |
| Interquartile 75% (IQ3) | 17.7% | 19.2% |
| Interquartile Range (IQR) | 6.5% | 6.0% |
| Standard Deviation (Sample) | 10.6% | 9.1% |
| Standard Deviation (Population) | 10.4% | 9.0% |
Demographics Similar to Spanish American Indians and Central Americans by Seniors Poverty Over the Age of 75
In terms of seniors poverty over the age of 75, the demographic groups most similar to Spanish American Indians are Native/Alaskan (15.5%, a difference of 0.10%), Honduran (15.4%, a difference of 0.44%), Yuman (15.4%, a difference of 0.72%), U.S. Virgin Islander (15.4%, a difference of 0.90%), and Immigrants from Jamaica (15.3%, a difference of 1.1%). Similarly, the demographic groups most similar to Central Americans are Belizean (14.8%, a difference of 0.12%), Immigrants from Senegal (14.8%, a difference of 0.29%), Guatemalan (14.8%, a difference of 0.35%), Black/African American (14.6%, a difference of 0.64%), and Cheyenne (14.9%, a difference of 0.99%).
| Demographics | Rating | Rank | Seniors Poverty Over the Age of 75 |
| Blacks/African Americans | 0.0 /100 | #279 | Tragic 14.6% |
| Central Americans | 0.0 /100 | #280 | Tragic 14.7% |
| Belizeans | 0.0 /100 | #281 | Tragic 14.8% |
| Immigrants | Senegal | 0.0 /100 | #282 | Tragic 14.8% |
| Guatemalans | 0.0 /100 | #283 | Tragic 14.8% |
| Cheyenne | 0.0 /100 | #284 | Tragic 14.9% |
| Immigrants | Mexico | 0.0 /100 | #285 | Tragic 14.9% |
| Immigrants | Central America | 0.0 /100 | #286 | Tragic 15.0% |
| Immigrants | Guatemala | 0.0 /100 | #287 | Tragic 15.1% |
| Jamaicans | 0.0 /100 | #288 | Tragic 15.1% |
| Immigrants | Belize | 0.0 /100 | #289 | Tragic 15.2% |
| Immigrants | Azores | 0.0 /100 | #290 | Tragic 15.2% |
| Paiute | 0.0 /100 | #291 | Tragic 15.2% |
| Colville | 0.0 /100 | #292 | Tragic 15.2% |
| Apache | 0.0 /100 | #293 | Tragic 15.3% |
| Immigrants | Jamaica | 0.0 /100 | #294 | Tragic 15.3% |
| U.S. Virgin Islanders | 0.0 /100 | #295 | Tragic 15.4% |
| Yuman | 0.0 /100 | #296 | Tragic 15.4% |
| Hondurans | 0.0 /100 | #297 | Tragic 15.4% |
| Natives/Alaskans | 0.0 /100 | #298 | Tragic 15.5% |
| Spanish American Indians | 0.0 /100 | #299 | Tragic 15.5% |