French vs Central American Seniors Poverty Over the Age of 75
COMPARE
French
Central American
Seniors Poverty Over the Age of 75
Seniors Poverty Over the Age of 75 Comparison
French
Central Americans
11.1%
SENIORS POVERTY OVER THE AGE OF 75
98.7/ 100
METRIC RATING
48th/ 347
METRIC RANK
14.7%
SENIORS POVERTY OVER THE AGE OF 75
0.0/ 100
METRIC RATING
280th/ 347
METRIC RANK
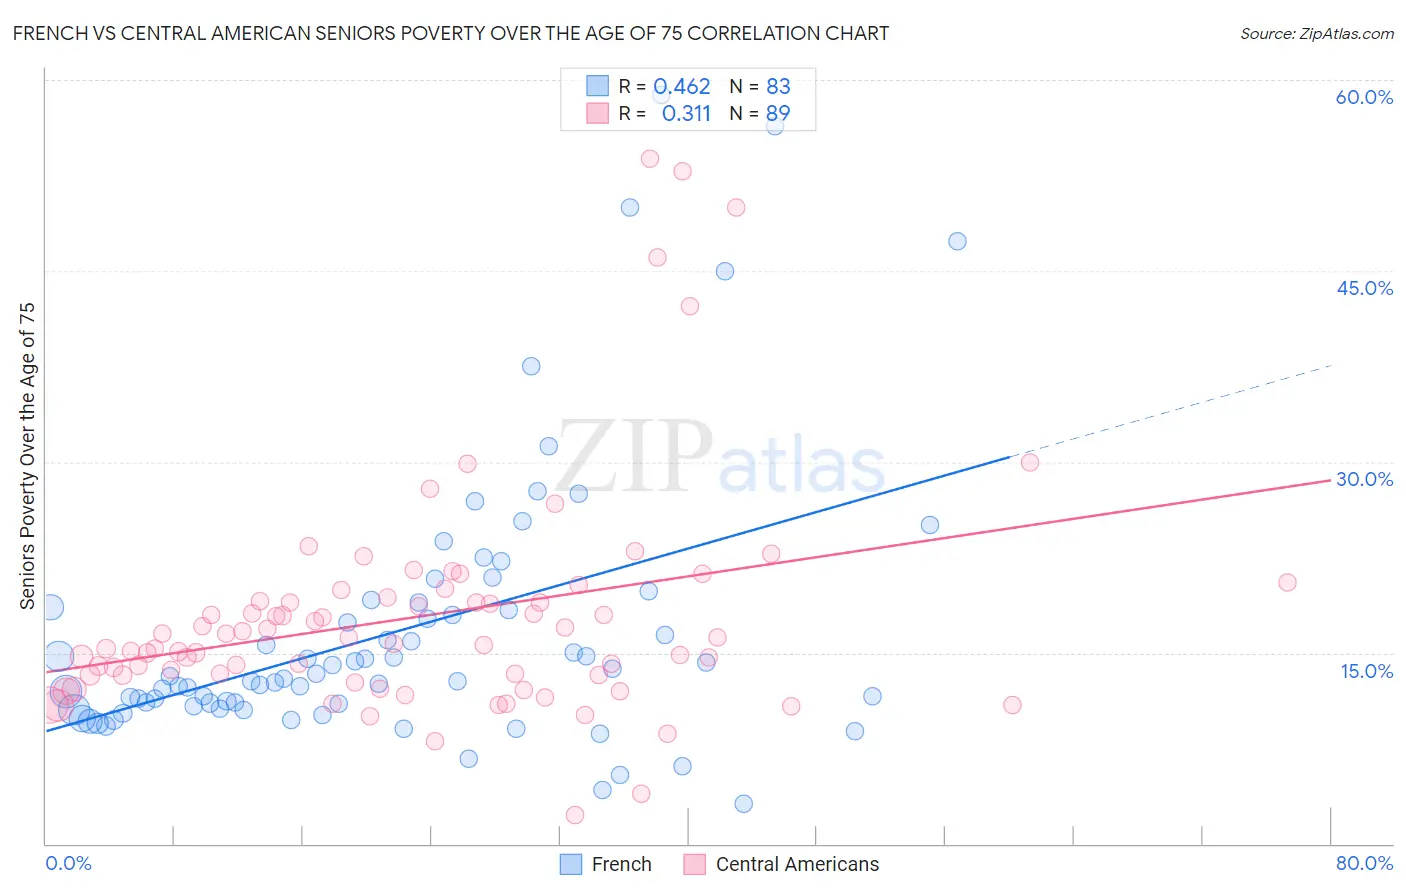
French vs Central American Seniors Poverty Over the Age of 75 Correlation Chart
The statistical analysis conducted on geographies consisting of 555,221,487 people shows a moderate positive correlation between the proportion of French and poverty level among seniors over the age of 75 in the United States with a correlation coefficient (R) of 0.462 and weighted average of 11.1%. Similarly, the statistical analysis conducted on geographies consisting of 495,711,598 people shows a mild positive correlation between the proportion of Central Americans and poverty level among seniors over the age of 75 in the United States with a correlation coefficient (R) of 0.311 and weighted average of 14.7%, a difference of 32.7%.
Seniors Poverty Over the Age of 75 Correlation Summary
| Measurement | French | Central American |
| Minimum | 3.1% | 2.3% |
| Maximum | 58.9% | 53.8% |
| Range | 55.7% | 51.5% |
| Mean | 16.7% | 17.8% |
| Median | 13.0% | 15.7% |
| Interquartile 25% (IQ1) | 10.8% | 13.2% |
| Interquartile 75% (IQ3) | 18.6% | 19.2% |
| Interquartile Range (IQR) | 7.8% | 6.0% |
| Standard Deviation (Sample) | 10.8% | 9.1% |
| Standard Deviation (Population) | 10.7% | 9.0% |
Similar Demographics by Seniors Poverty Over the Age of 75
Demographics Similar to French by Seniors Poverty Over the Age of 75
In terms of seniors poverty over the age of 75, the demographic groups most similar to French are Hawaiian (11.1%, a difference of 0.040%), Samoan (11.1%, a difference of 0.11%), Serbian (11.1%, a difference of 0.22%), Immigrants from North Macedonia (11.1%, a difference of 0.25%), and Zimbabwean (11.2%, a difference of 0.40%).
| Demographics | Rating | Rank | Seniors Poverty Over the Age of 75 |
| Immigrants | Lithuania | 99.2 /100 | #41 | Exceptional 11.0% |
| Austrians | 99.1 /100 | #42 | Exceptional 11.0% |
| Celtics | 99.1 /100 | #43 | Exceptional 11.0% |
| Belgians | 99.1 /100 | #44 | Exceptional 11.0% |
| Carpatho Rusyns | 99.0 /100 | #45 | Exceptional 11.1% |
| Greeks | 99.0 /100 | #46 | Exceptional 11.1% |
| Hawaiians | 98.8 /100 | #47 | Exceptional 11.1% |
| French | 98.7 /100 | #48 | Exceptional 11.1% |
| Samoans | 98.7 /100 | #49 | Exceptional 11.1% |
| Serbians | 98.6 /100 | #50 | Exceptional 11.1% |
| Immigrants | North Macedonia | 98.6 /100 | #51 | Exceptional 11.1% |
| Zimbabweans | 98.5 /100 | #52 | Exceptional 11.2% |
| Immigrants | England | 98.4 /100 | #53 | Exceptional 11.2% |
| Afghans | 98.2 /100 | #54 | Exceptional 11.2% |
| Hungarians | 98.1 /100 | #55 | Exceptional 11.2% |
Demographics Similar to Central Americans by Seniors Poverty Over the Age of 75
In terms of seniors poverty over the age of 75, the demographic groups most similar to Central Americans are Belizean (14.8%, a difference of 0.12%), Immigrants from Senegal (14.8%, a difference of 0.29%), Guatemalan (14.8%, a difference of 0.35%), Black/African American (14.6%, a difference of 0.64%), and Immigrants from Colombia (14.6%, a difference of 0.85%).
| Demographics | Rating | Rank | Seniors Poverty Over the Age of 75 |
| Immigrants | South America | 0.0 /100 | #273 | Tragic 14.4% |
| Immigrants | Bahamas | 0.0 /100 | #274 | Tragic 14.4% |
| Immigrants | El Salvador | 0.0 /100 | #275 | Tragic 14.5% |
| Soviet Union | 0.0 /100 | #276 | Tragic 14.5% |
| Senegalese | 0.0 /100 | #277 | Tragic 14.5% |
| Immigrants | Colombia | 0.0 /100 | #278 | Tragic 14.6% |
| Blacks/African Americans | 0.0 /100 | #279 | Tragic 14.6% |
| Central Americans | 0.0 /100 | #280 | Tragic 14.7% |
| Belizeans | 0.0 /100 | #281 | Tragic 14.8% |
| Immigrants | Senegal | 0.0 /100 | #282 | Tragic 14.8% |
| Guatemalans | 0.0 /100 | #283 | Tragic 14.8% |
| Cheyenne | 0.0 /100 | #284 | Tragic 14.9% |
| Immigrants | Mexico | 0.0 /100 | #285 | Tragic 14.9% |
| Immigrants | Central America | 0.0 /100 | #286 | Tragic 15.0% |
| Immigrants | Guatemala | 0.0 /100 | #287 | Tragic 15.1% |