Spanish American Indian vs Guyanese Seniors Poverty Over the Age of 75
COMPARE
Spanish American Indian
Guyanese
Seniors Poverty Over the Age of 75
Seniors Poverty Over the Age of 75 Comparison
Spanish American Indians
Guyanese
15.5%
SENIORS POVERTY OVER THE AGE OF 75
0.0/ 100
METRIC RATING
299th/ 347
METRIC RANK
16.1%
SENIORS POVERTY OVER THE AGE OF 75
0.0/ 100
METRIC RATING
315th/ 347
METRIC RANK
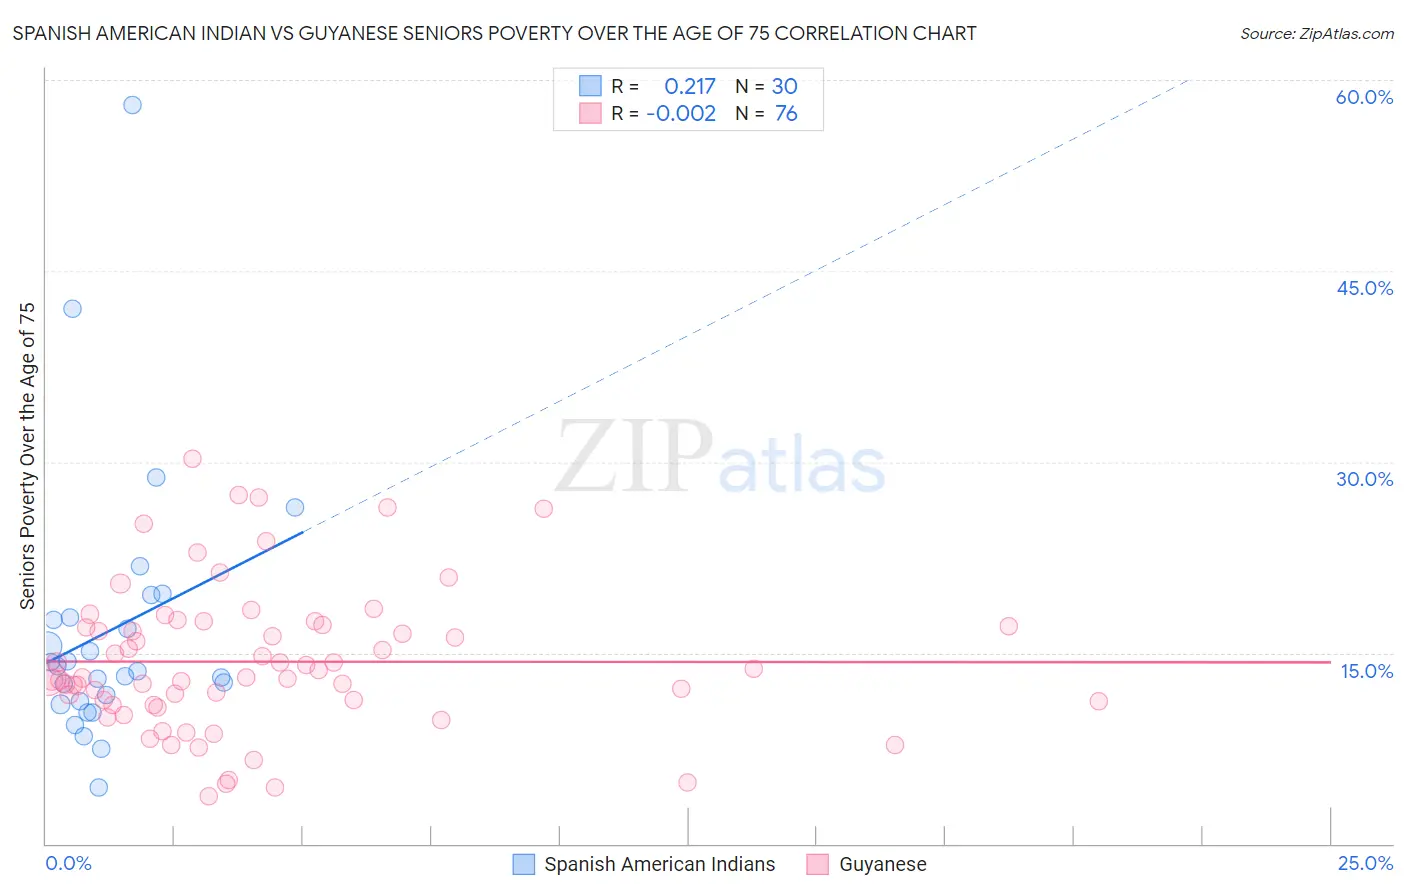
Spanish American Indian vs Guyanese Seniors Poverty Over the Age of 75 Correlation Chart
The statistical analysis conducted on geographies consisting of 73,033,240 people shows a weak positive correlation between the proportion of Spanish American Indians and poverty level among seniors over the age of 75 in the United States with a correlation coefficient (R) of 0.217 and weighted average of 15.5%. Similarly, the statistical analysis conducted on geographies consisting of 175,791,386 people shows no correlation between the proportion of Guyanese and poverty level among seniors over the age of 75 in the United States with a correlation coefficient (R) of -0.002 and weighted average of 16.1%, a difference of 3.9%.
Seniors Poverty Over the Age of 75 Correlation Summary
| Measurement | Spanish American Indian | Guyanese |
| Minimum | 4.4% | 3.7% |
| Maximum | 58.0% | 30.3% |
| Range | 53.6% | 26.6% |
| Mean | 16.8% | 14.3% |
| Median | 13.8% | 13.1% |
| Interquartile 25% (IQ1) | 11.2% | 11.0% |
| Interquartile 75% (IQ3) | 17.7% | 17.1% |
| Interquartile Range (IQR) | 6.5% | 6.1% |
| Standard Deviation (Sample) | 10.6% | 5.7% |
| Standard Deviation (Population) | 10.4% | 5.6% |
Demographics Similar to Spanish American Indians and Guyanese by Seniors Poverty Over the Age of 75
In terms of seniors poverty over the age of 75, the demographic groups most similar to Spanish American Indians are Bahamian (15.5%, a difference of 0.010%), Native/Alaskan (15.5%, a difference of 0.10%), Honduran (15.4%, a difference of 0.44%), Immigrants from Latin America (15.6%, a difference of 0.79%), and West Indian (15.7%, a difference of 1.1%). Similarly, the demographic groups most similar to Guyanese are Immigrants from Ecuador (16.1%, a difference of 0.010%), Tsimshian (16.1%, a difference of 0.30%), Immigrants from Guyana (16.2%, a difference of 0.62%), Barbadian (16.0%, a difference of 0.66%), and Crow (15.9%, a difference of 1.1%).
| Demographics | Rating | Rank | Seniors Poverty Over the Age of 75 |
| Hondurans | 0.0 /100 | #297 | Tragic 15.4% |
| Natives/Alaskans | 0.0 /100 | #298 | Tragic 15.5% |
| Spanish American Indians | 0.0 /100 | #299 | Tragic 15.5% |
| Bahamians | 0.0 /100 | #300 | Tragic 15.5% |
| Immigrants | Latin America | 0.0 /100 | #301 | Tragic 15.6% |
| West Indians | 0.0 /100 | #302 | Tragic 15.7% |
| Immigrants | Honduras | 0.0 /100 | #303 | Tragic 15.7% |
| Immigrants | Trinidad and Tobago | 0.0 /100 | #304 | Tragic 15.7% |
| Ecuadorians | 0.0 /100 | #305 | Tragic 15.7% |
| Hispanics or Latinos | 0.0 /100 | #306 | Tragic 15.8% |
| Immigrants | West Indies | 0.0 /100 | #307 | Tragic 15.8% |
| Immigrants | Bangladesh | 0.0 /100 | #308 | Tragic 15.8% |
| Yup'ik | 0.0 /100 | #309 | Tragic 15.8% |
| Vietnamese | 0.0 /100 | #310 | Tragic 15.9% |
| Trinidadians and Tobagonians | 0.0 /100 | #311 | Tragic 15.9% |
| Crow | 0.0 /100 | #312 | Tragic 15.9% |
| Barbadians | 0.0 /100 | #313 | Tragic 16.0% |
| Tsimshian | 0.0 /100 | #314 | Tragic 16.1% |
| Guyanese | 0.0 /100 | #315 | Tragic 16.1% |
| Immigrants | Ecuador | 0.0 /100 | #316 | Tragic 16.1% |
| Immigrants | Guyana | 0.0 /100 | #317 | Tragic 16.2% |