Spanish American Indian vs Ethiopian Seniors Poverty Over the Age of 75
COMPARE
Spanish American Indian
Ethiopian
Seniors Poverty Over the Age of 75
Seniors Poverty Over the Age of 75 Comparison
Spanish American Indians
Ethiopians
15.5%
SENIORS POVERTY OVER THE AGE OF 75
0.0/ 100
METRIC RATING
299th/ 347
METRIC RANK
11.8%
SENIORS POVERTY OVER THE AGE OF 75
80.7/ 100
METRIC RATING
129th/ 347
METRIC RANK
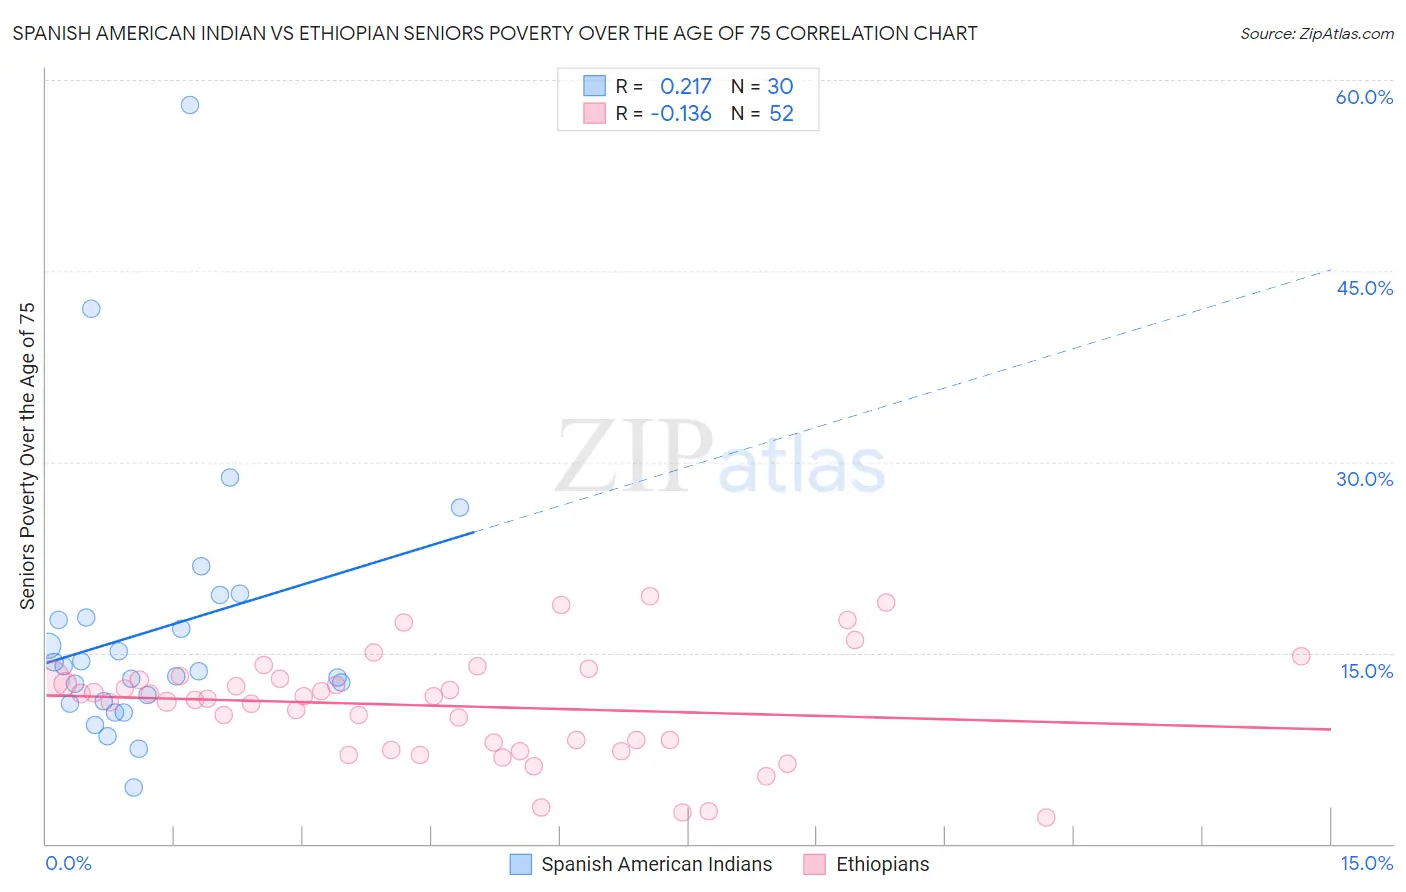
Spanish American Indian vs Ethiopian Seniors Poverty Over the Age of 75 Correlation Chart
The statistical analysis conducted on geographies consisting of 73,033,240 people shows a weak positive correlation between the proportion of Spanish American Indians and poverty level among seniors over the age of 75 in the United States with a correlation coefficient (R) of 0.217 and weighted average of 15.5%. Similarly, the statistical analysis conducted on geographies consisting of 221,776,258 people shows a poor negative correlation between the proportion of Ethiopians and poverty level among seniors over the age of 75 in the United States with a correlation coefficient (R) of -0.136 and weighted average of 11.8%, a difference of 31.1%.
Seniors Poverty Over the Age of 75 Correlation Summary
| Measurement | Spanish American Indian | Ethiopian |
| Minimum | 4.4% | 2.1% |
| Maximum | 58.0% | 19.5% |
| Range | 53.6% | 17.4% |
| Mean | 16.8% | 10.8% |
| Median | 13.8% | 11.5% |
| Interquartile 25% (IQ1) | 11.2% | 7.7% |
| Interquartile 75% (IQ3) | 17.7% | 13.0% |
| Interquartile Range (IQR) | 6.5% | 5.3% |
| Standard Deviation (Sample) | 10.6% | 4.2% |
| Standard Deviation (Population) | 10.4% | 4.1% |
Similar Demographics by Seniors Poverty Over the Age of 75
Demographics Similar to Spanish American Indians by Seniors Poverty Over the Age of 75
In terms of seniors poverty over the age of 75, the demographic groups most similar to Spanish American Indians are Bahamian (15.5%, a difference of 0.010%), Native/Alaskan (15.5%, a difference of 0.10%), Honduran (15.4%, a difference of 0.44%), Yuman (15.4%, a difference of 0.72%), and Immigrants from Latin America (15.6%, a difference of 0.79%).
| Demographics | Rating | Rank | Seniors Poverty Over the Age of 75 |
| Colville | 0.0 /100 | #292 | Tragic 15.2% |
| Apache | 0.0 /100 | #293 | Tragic 15.3% |
| Immigrants | Jamaica | 0.0 /100 | #294 | Tragic 15.3% |
| U.S. Virgin Islanders | 0.0 /100 | #295 | Tragic 15.4% |
| Yuman | 0.0 /100 | #296 | Tragic 15.4% |
| Hondurans | 0.0 /100 | #297 | Tragic 15.4% |
| Natives/Alaskans | 0.0 /100 | #298 | Tragic 15.5% |
| Spanish American Indians | 0.0 /100 | #299 | Tragic 15.5% |
| Bahamians | 0.0 /100 | #300 | Tragic 15.5% |
| Immigrants | Latin America | 0.0 /100 | #301 | Tragic 15.6% |
| West Indians | 0.0 /100 | #302 | Tragic 15.7% |
| Immigrants | Honduras | 0.0 /100 | #303 | Tragic 15.7% |
| Immigrants | Trinidad and Tobago | 0.0 /100 | #304 | Tragic 15.7% |
| Ecuadorians | 0.0 /100 | #305 | Tragic 15.7% |
| Hispanics or Latinos | 0.0 /100 | #306 | Tragic 15.8% |
Demographics Similar to Ethiopians by Seniors Poverty Over the Age of 75
In terms of seniors poverty over the age of 75, the demographic groups most similar to Ethiopians are Spanish (11.8%, a difference of 0.020%), Immigrants from Western Europe (11.9%, a difference of 0.14%), Immigrants from Hungary (11.8%, a difference of 0.15%), Immigrants from Denmark (11.8%, a difference of 0.27%), and Lebanese (11.9%, a difference of 0.30%).
| Demographics | Rating | Rank | Seniors Poverty Over the Age of 75 |
| Pakistanis | 84.0 /100 | #122 | Excellent 11.8% |
| Immigrants | Italy | 84.0 /100 | #123 | Excellent 11.8% |
| Fijians | 83.8 /100 | #124 | Excellent 11.8% |
| Sudanese | 83.6 /100 | #125 | Excellent 11.8% |
| Pennsylvania Germans | 83.4 /100 | #126 | Excellent 11.8% |
| Immigrants | Denmark | 82.6 /100 | #127 | Excellent 11.8% |
| Immigrants | Hungary | 81.7 /100 | #128 | Excellent 11.8% |
| Ethiopians | 80.7 /100 | #129 | Excellent 11.8% |
| Spanish | 80.5 /100 | #130 | Excellent 11.8% |
| Immigrants | Western Europe | 79.6 /100 | #131 | Good 11.9% |
| Lebanese | 78.3 /100 | #132 | Good 11.9% |
| Immigrants | Sierra Leone | 77.6 /100 | #133 | Good 11.9% |
| Ugandans | 77.1 /100 | #134 | Good 11.9% |
| Immigrants | Ireland | 76.2 /100 | #135 | Good 11.9% |
| Immigrants | Philippines | 75.0 /100 | #136 | Good 11.9% |