Spanish American Indian vs Immigrants from Uruguay Seniors Poverty Over the Age of 75
COMPARE
Spanish American Indian
Immigrants from Uruguay
Seniors Poverty Over the Age of 75
Seniors Poverty Over the Age of 75 Comparison
Spanish American Indians
Immigrants from Uruguay
15.5%
SENIORS POVERTY OVER THE AGE OF 75
0.0/ 100
METRIC RATING
299th/ 347
METRIC RANK
14.3%
SENIORS POVERTY OVER THE AGE OF 75
0.0/ 100
METRIC RATING
270th/ 347
METRIC RANK
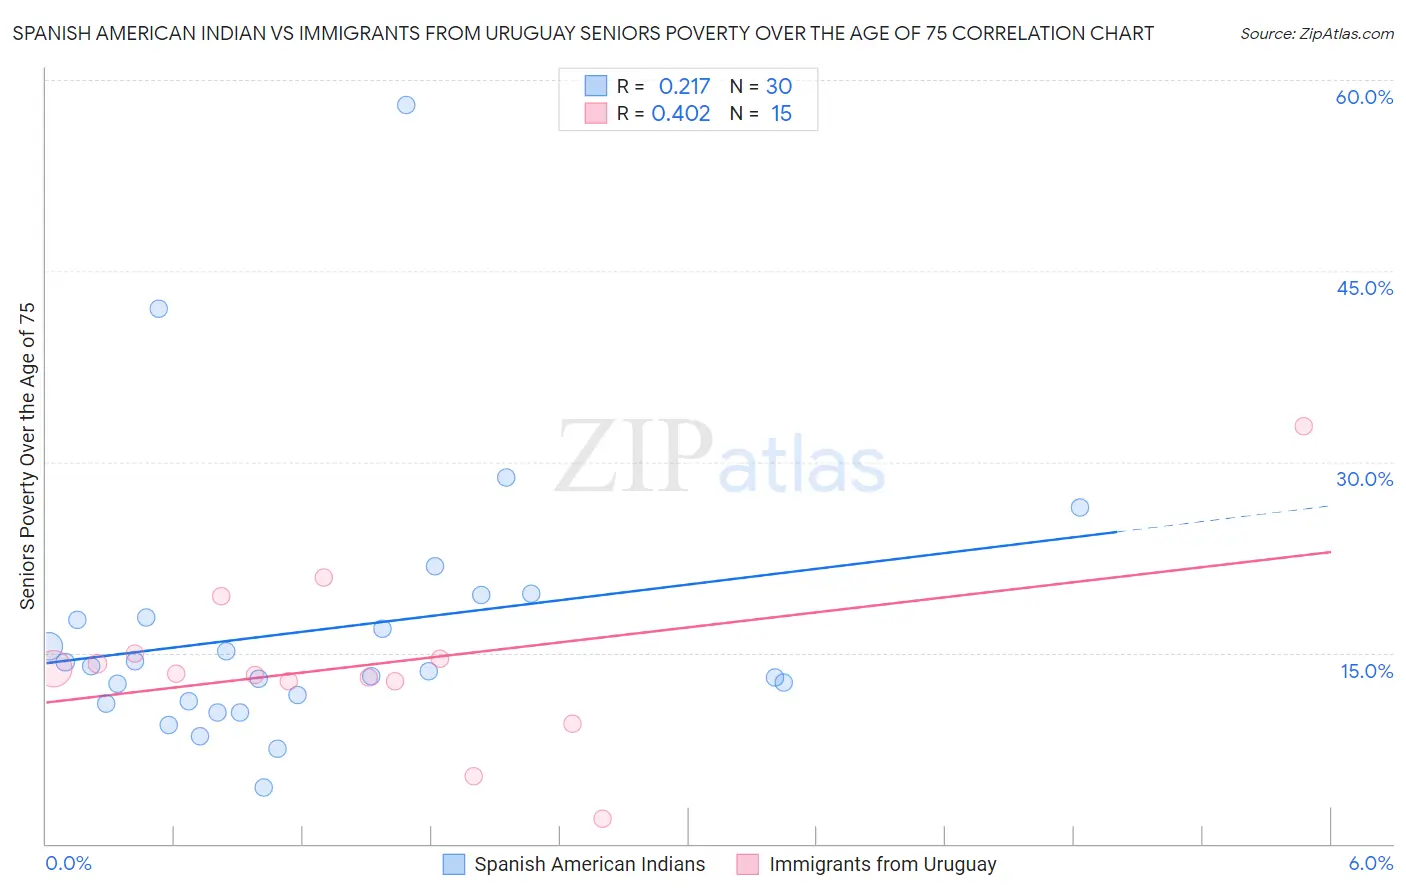
Spanish American Indian vs Immigrants from Uruguay Seniors Poverty Over the Age of 75 Correlation Chart
The statistical analysis conducted on geographies consisting of 73,033,240 people shows a weak positive correlation between the proportion of Spanish American Indians and poverty level among seniors over the age of 75 in the United States with a correlation coefficient (R) of 0.217 and weighted average of 15.5%. Similarly, the statistical analysis conducted on geographies consisting of 132,859,221 people shows a moderate positive correlation between the proportion of Immigrants from Uruguay and poverty level among seniors over the age of 75 in the United States with a correlation coefficient (R) of 0.402 and weighted average of 14.3%, a difference of 8.5%.
Seniors Poverty Over the Age of 75 Correlation Summary
| Measurement | Spanish American Indian | Immigrants from Uruguay |
| Minimum | 4.4% | 2.0% |
| Maximum | 58.0% | 32.8% |
| Range | 53.6% | 30.8% |
| Mean | 16.8% | 14.2% |
| Median | 13.8% | 13.4% |
| Interquartile 25% (IQ1) | 11.2% | 12.8% |
| Interquartile 75% (IQ3) | 17.7% | 15.0% |
| Interquartile Range (IQR) | 6.5% | 2.2% |
| Standard Deviation (Sample) | 10.6% | 7.0% |
| Standard Deviation (Population) | 10.4% | 6.7% |
Similar Demographics by Seniors Poverty Over the Age of 75
Demographics Similar to Spanish American Indians by Seniors Poverty Over the Age of 75
In terms of seniors poverty over the age of 75, the demographic groups most similar to Spanish American Indians are Bahamian (15.5%, a difference of 0.010%), Native/Alaskan (15.5%, a difference of 0.10%), Honduran (15.4%, a difference of 0.44%), Yuman (15.4%, a difference of 0.72%), and Immigrants from Latin America (15.6%, a difference of 0.79%).
| Demographics | Rating | Rank | Seniors Poverty Over the Age of 75 |
| Colville | 0.0 /100 | #292 | Tragic 15.2% |
| Apache | 0.0 /100 | #293 | Tragic 15.3% |
| Immigrants | Jamaica | 0.0 /100 | #294 | Tragic 15.3% |
| U.S. Virgin Islanders | 0.0 /100 | #295 | Tragic 15.4% |
| Yuman | 0.0 /100 | #296 | Tragic 15.4% |
| Hondurans | 0.0 /100 | #297 | Tragic 15.4% |
| Natives/Alaskans | 0.0 /100 | #298 | Tragic 15.5% |
| Spanish American Indians | 0.0 /100 | #299 | Tragic 15.5% |
| Bahamians | 0.0 /100 | #300 | Tragic 15.5% |
| Immigrants | Latin America | 0.0 /100 | #301 | Tragic 15.6% |
| West Indians | 0.0 /100 | #302 | Tragic 15.7% |
| Immigrants | Honduras | 0.0 /100 | #303 | Tragic 15.7% |
| Immigrants | Trinidad and Tobago | 0.0 /100 | #304 | Tragic 15.7% |
| Ecuadorians | 0.0 /100 | #305 | Tragic 15.7% |
| Hispanics or Latinos | 0.0 /100 | #306 | Tragic 15.8% |
Demographics Similar to Immigrants from Uruguay by Seniors Poverty Over the Age of 75
In terms of seniors poverty over the age of 75, the demographic groups most similar to Immigrants from Uruguay are Immigrants from Venezuela (14.3%, a difference of 0.14%), Colombian (14.3%, a difference of 0.25%), Immigrants from Ghana (14.4%, a difference of 0.48%), Venezuelan (14.2%, a difference of 0.59%), and Mexican (14.4%, a difference of 0.59%).
| Demographics | Rating | Rank | Seniors Poverty Over the Age of 75 |
| Iroquois | 0.1 /100 | #263 | Tragic 14.0% |
| South Americans | 0.0 /100 | #264 | Tragic 14.1% |
| Salvadorans | 0.0 /100 | #265 | Tragic 14.2% |
| Armenians | 0.0 /100 | #266 | Tragic 14.2% |
| Venezuelans | 0.0 /100 | #267 | Tragic 14.2% |
| Colombians | 0.0 /100 | #268 | Tragic 14.3% |
| Immigrants | Venezuela | 0.0 /100 | #269 | Tragic 14.3% |
| Immigrants | Uruguay | 0.0 /100 | #270 | Tragic 14.3% |
| Immigrants | Ghana | 0.0 /100 | #271 | Tragic 14.4% |
| Mexicans | 0.0 /100 | #272 | Tragic 14.4% |
| Immigrants | South America | 0.0 /100 | #273 | Tragic 14.4% |
| Immigrants | Bahamas | 0.0 /100 | #274 | Tragic 14.4% |
| Immigrants | El Salvador | 0.0 /100 | #275 | Tragic 14.5% |
| Soviet Union | 0.0 /100 | #276 | Tragic 14.5% |
| Senegalese | 0.0 /100 | #277 | Tragic 14.5% |