Basque vs New Zealander Single Male Poverty
COMPARE
Basque
New Zealander
Single Male Poverty
Single Male Poverty Comparison
Basques
New Zealanders
13.0%
SINGLE MALE POVERTY
20.7/ 100
METRIC RATING
202nd/ 347
METRIC RANK
13.2%
SINGLE MALE POVERTY
10.7/ 100
METRIC RATING
221st/ 347
METRIC RANK
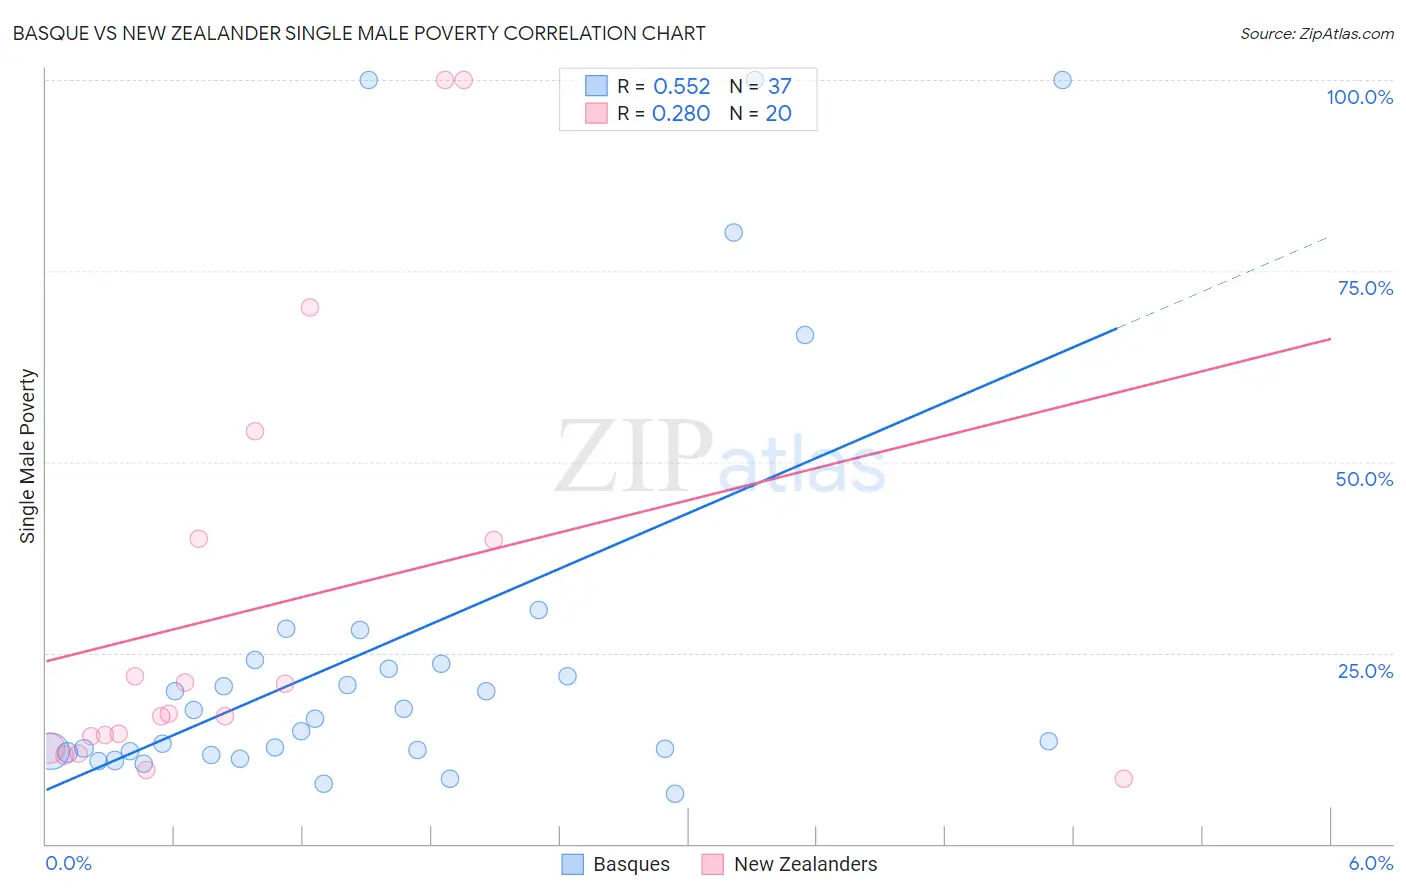
Basque vs New Zealander Single Male Poverty Correlation Chart
The statistical analysis conducted on geographies consisting of 155,521,610 people shows a substantial positive correlation between the proportion of Basques and poverty level among single males in the United States with a correlation coefficient (R) of 0.552 and weighted average of 13.0%. Similarly, the statistical analysis conducted on geographies consisting of 101,681,215 people shows a weak positive correlation between the proportion of New Zealanders and poverty level among single males in the United States with a correlation coefficient (R) of 0.280 and weighted average of 13.2%, a difference of 1.0%.
Single Male Poverty Correlation Summary
| Measurement | Basque | New Zealander |
| Minimum | 6.6% | 8.6% |
| Maximum | 100.0% | 100.0% |
| Range | 93.4% | 91.4% |
| Mean | 26.0% | 30.8% |
| Median | 16.3% | 16.9% |
| Interquartile 25% (IQ1) | 12.0% | 13.3% |
| Interquartile 75% (IQ3) | 23.8% | 39.9% |
| Interquartile Range (IQR) | 11.8% | 26.6% |
| Standard Deviation (Sample) | 26.5% | 28.6% |
| Standard Deviation (Population) | 26.2% | 27.9% |
Demographics Similar to Basques and New Zealanders by Single Male Poverty
In terms of single male poverty, the demographic groups most similar to Basques are Immigrants from Bangladesh (13.0%, a difference of 0.030%), Estonian (13.0%, a difference of 0.030%), Trinidadian and Tobagonian (13.0%, a difference of 0.060%), Polish (13.0%, a difference of 0.11%), and Northern European (13.0%, a difference of 0.15%). Similarly, the demographic groups most similar to New Zealanders are Central American (13.2%, a difference of 0.020%), Immigrants from Burma/Myanmar (13.1%, a difference of 0.24%), Scandinavian (13.1%, a difference of 0.27%), Bermudan (13.1%, a difference of 0.29%), and Austrian (13.1%, a difference of 0.39%).
| Demographics | Rating | Rank | Single Male Poverty |
| Trinidadians and Tobagonians | 21.4 /100 | #201 | Fair 13.0% |
| Basques | 20.7 /100 | #202 | Fair 13.0% |
| Immigrants | Bangladesh | 20.4 /100 | #203 | Fair 13.0% |
| Estonians | 20.3 /100 | #204 | Fair 13.0% |
| Poles | 19.3 /100 | #205 | Poor 13.0% |
| Northern Europeans | 18.9 /100 | #206 | Poor 13.0% |
| Sudanese | 17.7 /100 | #207 | Poor 13.1% |
| Immigrants | Western Africa | 17.6 /100 | #208 | Poor 13.1% |
| Mexican American Indians | 17.5 /100 | #209 | Poor 13.1% |
| Immigrants | Haiti | 16.8 /100 | #210 | Poor 13.1% |
| Swedes | 16.8 /100 | #211 | Poor 13.1% |
| Senegalese | 16.4 /100 | #212 | Poor 13.1% |
| Italians | 15.9 /100 | #213 | Poor 13.1% |
| Zimbabweans | 14.9 /100 | #214 | Poor 13.1% |
| Japanese | 14.8 /100 | #215 | Poor 13.1% |
| Austrians | 13.9 /100 | #216 | Poor 13.1% |
| Bermudans | 13.0 /100 | #217 | Poor 13.1% |
| Scandinavians | 12.9 /100 | #218 | Poor 13.1% |
| Immigrants | Burma/Myanmar | 12.6 /100 | #219 | Poor 13.1% |
| Central Americans | 10.9 /100 | #220 | Poor 13.2% |
| New Zealanders | 10.7 /100 | #221 | Poor 13.2% |