Filipino vs New Zealander Single Male Poverty
COMPARE
Filipino
New Zealander
Single Male Poverty
Single Male Poverty Comparison
Filipinos
New Zealanders
10.6%
SINGLE MALE POVERTY
100.0/ 100
METRIC RATING
6th/ 347
METRIC RANK
13.2%
SINGLE MALE POVERTY
10.7/ 100
METRIC RATING
221st/ 347
METRIC RANK
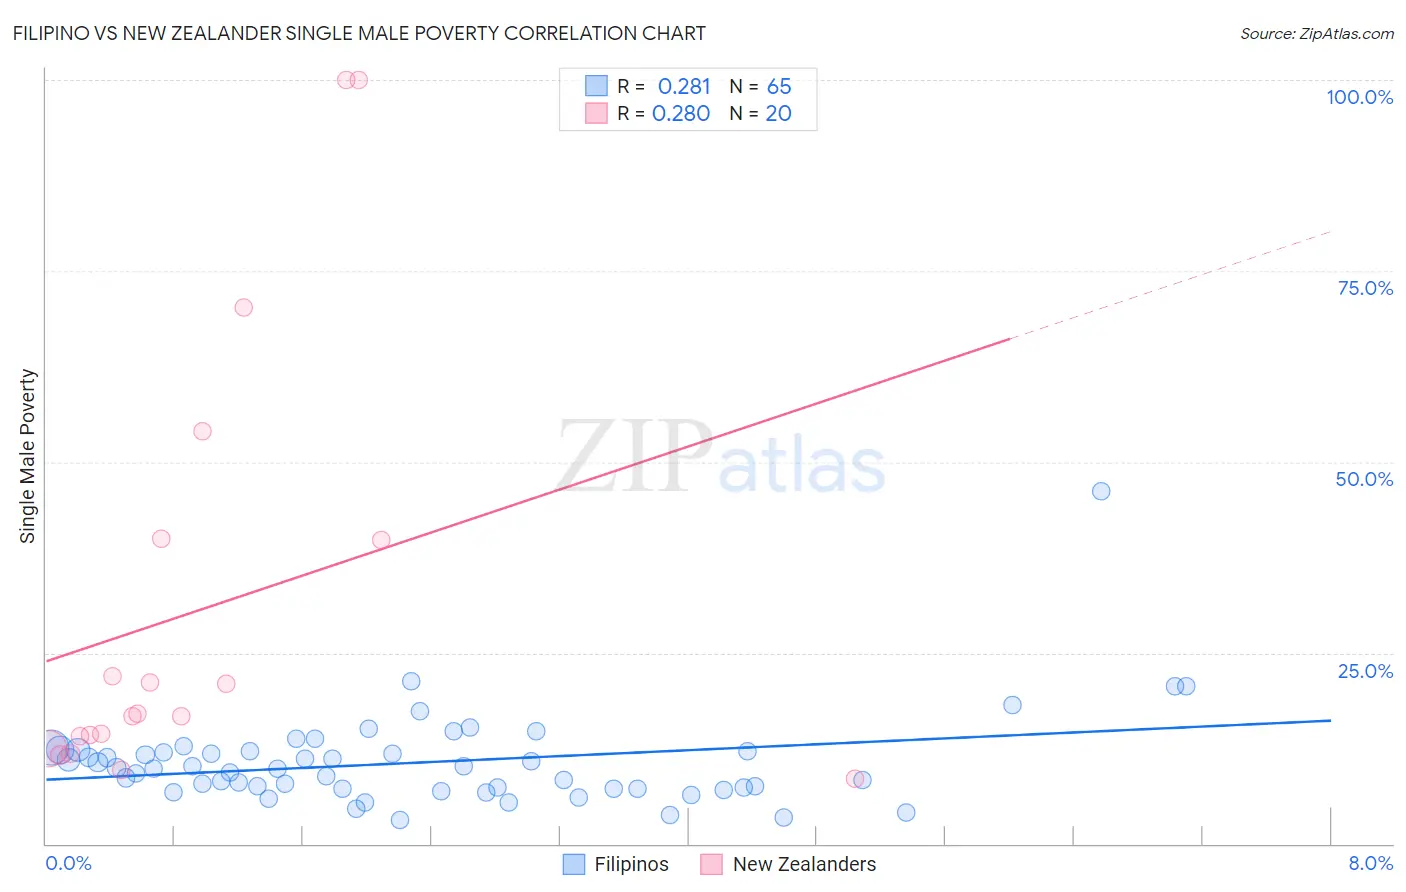
Filipino vs New Zealander Single Male Poverty Correlation Chart
The statistical analysis conducted on geographies consisting of 229,961,991 people shows a weak positive correlation between the proportion of Filipinos and poverty level among single males in the United States with a correlation coefficient (R) of 0.281 and weighted average of 10.6%. Similarly, the statistical analysis conducted on geographies consisting of 101,681,215 people shows a weak positive correlation between the proportion of New Zealanders and poverty level among single males in the United States with a correlation coefficient (R) of 0.280 and weighted average of 13.2%, a difference of 23.8%.
Single Male Poverty Correlation Summary
| Measurement | Filipino | New Zealander |
| Minimum | 3.1% | 8.6% |
| Maximum | 46.2% | 100.0% |
| Range | 43.1% | 91.4% |
| Mean | 10.6% | 30.8% |
| Median | 9.8% | 16.9% |
| Interquartile 25% (IQ1) | 7.2% | 13.3% |
| Interquartile 75% (IQ3) | 12.2% | 39.9% |
| Interquartile Range (IQR) | 4.9% | 26.6% |
| Standard Deviation (Sample) | 6.0% | 28.6% |
| Standard Deviation (Population) | 6.0% | 27.9% |
Similar Demographics by Single Male Poverty
Demographics Similar to Filipinos by Single Male Poverty
In terms of single male poverty, the demographic groups most similar to Filipinos are Afghan (10.7%, a difference of 0.75%), Thai (10.8%, a difference of 1.2%), Tongan (10.5%, a difference of 1.7%), Immigrants from Hong Kong (10.4%, a difference of 1.7%), and Taiwanese (10.9%, a difference of 2.5%).
| Demographics | Rating | Rank | Single Male Poverty |
| Assyrians/Chaldeans/Syriacs | 100.0 /100 | #1 | Exceptional 9.8% |
| Immigrants | Taiwan | 100.0 /100 | #2 | Exceptional 10.3% |
| Immigrants | India | 100.0 /100 | #3 | Exceptional 10.3% |
| Immigrants | Hong Kong | 100.0 /100 | #4 | Exceptional 10.4% |
| Tongans | 100.0 /100 | #5 | Exceptional 10.5% |
| Filipinos | 100.0 /100 | #6 | Exceptional 10.6% |
| Afghans | 100.0 /100 | #7 | Exceptional 10.7% |
| Thais | 100.0 /100 | #8 | Exceptional 10.8% |
| Taiwanese | 100.0 /100 | #9 | Exceptional 10.9% |
| Immigrants | Fiji | 100.0 /100 | #10 | Exceptional 10.9% |
| Immigrants | Philippines | 100.0 /100 | #11 | Exceptional 10.9% |
| Immigrants | Afghanistan | 100.0 /100 | #12 | Exceptional 10.9% |
| Immigrants | South Central Asia | 100.0 /100 | #13 | Exceptional 10.9% |
| Chinese | 100.0 /100 | #14 | Exceptional 11.0% |
| Koreans | 100.0 /100 | #15 | Exceptional 11.0% |
Demographics Similar to New Zealanders by Single Male Poverty
In terms of single male poverty, the demographic groups most similar to New Zealanders are Central American (13.2%, a difference of 0.020%), Immigrants from Western Europe (13.2%, a difference of 0.090%), Immigrants from the Azores (13.2%, a difference of 0.20%), Immigrants from Burma/Myanmar (13.1%, a difference of 0.24%), and Somali (13.2%, a difference of 0.24%).
| Demographics | Rating | Rank | Single Male Poverty |
| Zimbabweans | 14.9 /100 | #214 | Poor 13.1% |
| Japanese | 14.8 /100 | #215 | Poor 13.1% |
| Austrians | 13.9 /100 | #216 | Poor 13.1% |
| Bermudans | 13.0 /100 | #217 | Poor 13.1% |
| Scandinavians | 12.9 /100 | #218 | Poor 13.1% |
| Immigrants | Burma/Myanmar | 12.6 /100 | #219 | Poor 13.1% |
| Central Americans | 10.9 /100 | #220 | Poor 13.2% |
| New Zealanders | 10.7 /100 | #221 | Poor 13.2% |
| Immigrants | Western Europe | 10.0 /100 | #222 | Poor 13.2% |
| Immigrants | Azores | 9.3 /100 | #223 | Tragic 13.2% |
| Somalis | 9.1 /100 | #224 | Tragic 13.2% |
| Immigrants | Denmark | 8.7 /100 | #225 | Tragic 13.2% |
| Jamaicans | 7.7 /100 | #226 | Tragic 13.2% |
| Haitians | 7.0 /100 | #227 | Tragic 13.2% |
| Lebanese | 6.6 /100 | #228 | Tragic 13.2% |