Spaniard vs Immigrants from Kuwait Child Poverty Among Boys Under 16
COMPARE
Spaniard
Immigrants from Kuwait
Child Poverty Among Boys Under 16
Child Poverty Among Boys Under 16 Comparison
Spaniards
Immigrants from Kuwait
17.1%
CHILD POVERTY AMONG BOYS UNDER 16
20.5/ 100
METRIC RATING
196th/ 347
METRIC RANK
15.6%
CHILD POVERTY AMONG BOYS UNDER 16
85.6/ 100
METRIC RATING
140th/ 347
METRIC RANK
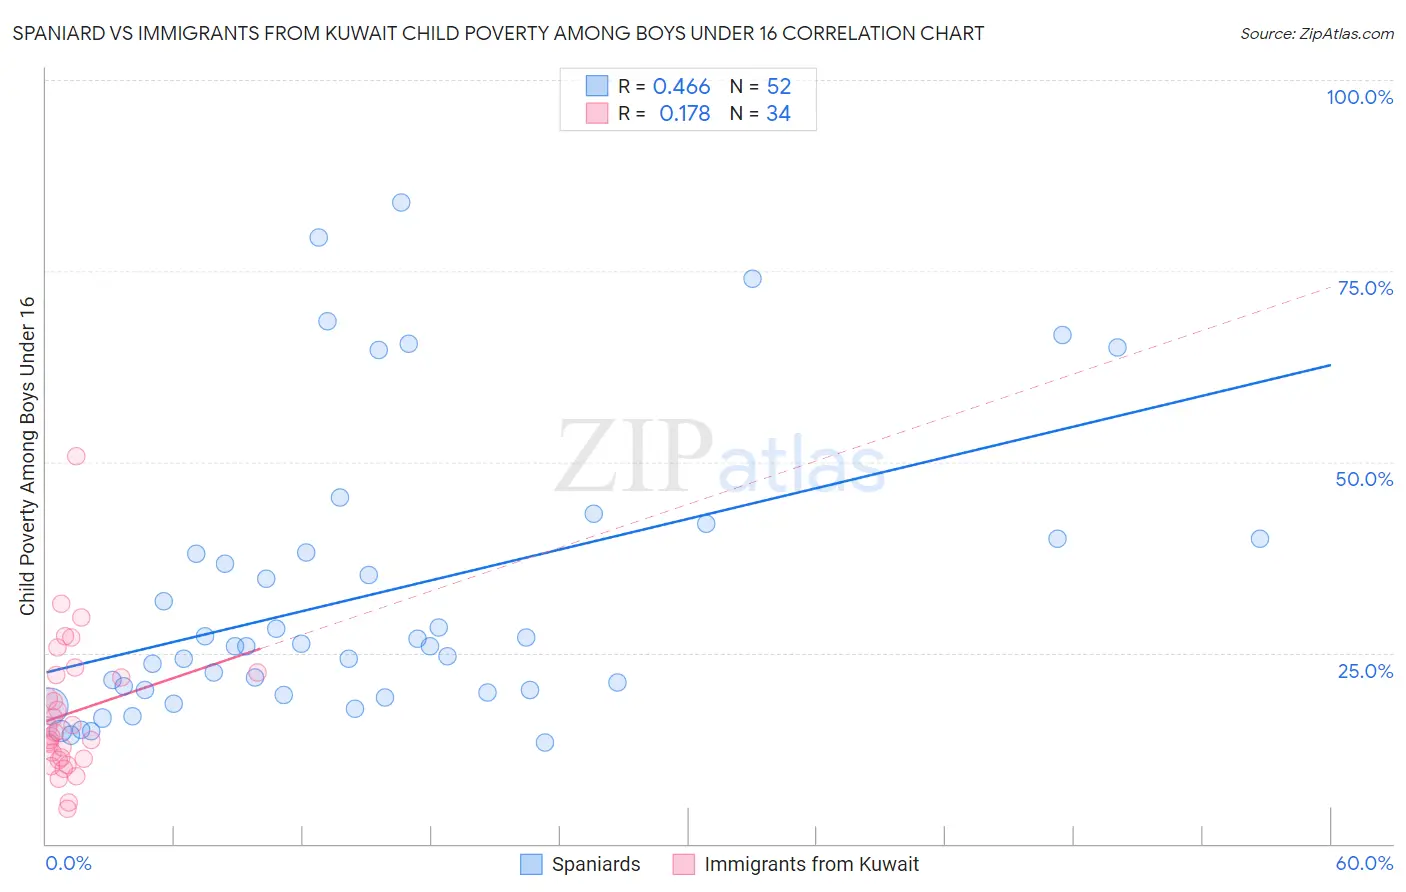
Spaniard vs Immigrants from Kuwait Child Poverty Among Boys Under 16 Correlation Chart
The statistical analysis conducted on geographies consisting of 435,078,567 people shows a moderate positive correlation between the proportion of Spaniards and poverty level among boys under the age of 16 in the United States with a correlation coefficient (R) of 0.466 and weighted average of 17.1%. Similarly, the statistical analysis conducted on geographies consisting of 136,275,840 people shows a poor positive correlation between the proportion of Immigrants from Kuwait and poverty level among boys under the age of 16 in the United States with a correlation coefficient (R) of 0.178 and weighted average of 15.6%, a difference of 9.2%.
Child Poverty Among Boys Under 16 Correlation Summary
| Measurement | Spaniard | Immigrants from Kuwait |
| Minimum | 13.2% | 4.6% |
| Maximum | 83.9% | 50.7% |
| Range | 70.7% | 46.1% |
| Mean | 32.6% | 17.1% |
| Median | 25.9% | 14.3% |
| Interquartile 25% (IQ1) | 19.9% | 11.1% |
| Interquartile 75% (IQ3) | 39.1% | 22.1% |
| Interquartile Range (IQR) | 19.2% | 11.0% |
| Standard Deviation (Sample) | 18.6% | 9.0% |
| Standard Deviation (Population) | 18.4% | 8.9% |
Similar Demographics by Child Poverty Among Boys Under 16
Demographics Similar to Spaniards by Child Poverty Among Boys Under 16
In terms of child poverty among boys under 16, the demographic groups most similar to Spaniards are Spanish (17.0%, a difference of 0.040%), Immigrants from Kenya (17.1%, a difference of 0.060%), Immigrants from Lebanon (17.0%, a difference of 0.12%), Immigrants from Uganda (17.0%, a difference of 0.18%), and Immigrants from Iraq (17.0%, a difference of 0.18%).
| Demographics | Rating | Rank | Child Poverty Among Boys Under 16 |
| Immigrants | Morocco | 34.5 /100 | #189 | Fair 16.7% |
| Arabs | 31.1 /100 | #190 | Fair 16.8% |
| Alaska Natives | 29.8 /100 | #191 | Fair 16.8% |
| Immigrants | Uganda | 21.6 /100 | #192 | Fair 17.0% |
| Immigrants | Iraq | 21.6 /100 | #193 | Fair 17.0% |
| Immigrants | Lebanon | 21.2 /100 | #194 | Fair 17.0% |
| Spanish | 20.8 /100 | #195 | Fair 17.0% |
| Spaniards | 20.5 /100 | #196 | Fair 17.1% |
| Immigrants | Kenya | 20.1 /100 | #197 | Fair 17.1% |
| Immigrants | Cameroon | 19.0 /100 | #198 | Poor 17.1% |
| Delaware | 18.8 /100 | #199 | Poor 17.1% |
| Immigrants | Uruguay | 16.9 /100 | #200 | Poor 17.2% |
| Immigrants | Afghanistan | 13.7 /100 | #201 | Poor 17.3% |
| Immigrants | Sierra Leone | 13.4 /100 | #202 | Poor 17.3% |
| Immigrants | Uzbekistan | 13.3 /100 | #203 | Poor 17.3% |
Demographics Similar to Immigrants from Kuwait by Child Poverty Among Boys Under 16
In terms of child poverty among boys under 16, the demographic groups most similar to Immigrants from Kuwait are Albanian (15.6%, a difference of 0.22%), Immigrants from Southern Europe (15.6%, a difference of 0.23%), Slavic (15.7%, a difference of 0.26%), Immigrants from Hungary (15.7%, a difference of 0.35%), and Immigrants from Spain (15.6%, a difference of 0.38%).
| Demographics | Rating | Rank | Child Poverty Among Boys Under 16 |
| Welsh | 88.3 /100 | #133 | Excellent 15.5% |
| Peruvians | 88.1 /100 | #134 | Excellent 15.5% |
| Portuguese | 87.5 /100 | #135 | Excellent 15.5% |
| Icelanders | 87.5 /100 | #136 | Excellent 15.5% |
| Immigrants | Spain | 87.1 /100 | #137 | Excellent 15.6% |
| Immigrants | Southern Europe | 86.5 /100 | #138 | Excellent 15.6% |
| Albanians | 86.5 /100 | #139 | Excellent 15.6% |
| Immigrants | Kuwait | 85.6 /100 | #140 | Excellent 15.6% |
| Slavs | 84.5 /100 | #141 | Excellent 15.7% |
| Immigrants | Hungary | 84.1 /100 | #142 | Excellent 15.7% |
| Immigrants | Fiji | 83.6 /100 | #143 | Excellent 15.7% |
| Immigrants | Peru | 83.5 /100 | #144 | Excellent 15.7% |
| Samoans | 83.2 /100 | #145 | Excellent 15.7% |
| New Zealanders | 82.4 /100 | #146 | Excellent 15.7% |
| Venezuelans | 82.1 /100 | #147 | Excellent 15.7% |