Icelander vs Immigrants from El Salvador Child Poverty Among Boys Under 16

COMPARE

Icelander
Race
Ancestry
AfghanAfricanAlaska NativeAlaskan AthabascanAlbanianAleutAlsatianAmericanApacheArabArapahoArgentineanArmenianAssyrian/Chaldean/SyriacAustralianAustrianBahamianBangladeshiBarbadianBasqueBelgianBelizeanBermudanBhutaneseBlackfeetBolivianBrazilianBritishBritish West IndianBulgarianBurmeseCajunCambodianCanadianCape VerdeanCarpatho RusynCelticCentral AmericanCentral American IndianCherokeeCheyenneChickasawChileanChineseChippewaChoctawColombianColvilleComancheCosta RicanCreeCreekCroatianCrowCubanCypriotCzechCzechoslovakianDanishDelawareDominicanDutchDutch West IndianEastern EuropeanEcuadorianEgyptianEnglishEstonianEthiopianEuropeanFijianFilipinoFinnishFrenchFrench American IndianFrench CanadianGermanGerman RussianGhanaianGreekGuamanian/ChamorroGuatemalanGuyaneseHaitianHmongHonduranHopiHoumaHungarianIcelanderIndian (Asian)IndonesianInupiatIranianIraqiIrishIroquoisIsraeliItalianJamaicanJapaneseJordanianKenyanKiowaKoreanLaotianLatvianLebaneseLiberianLithuanianLumbeeLuxembourgerMacedonianMalaysianMalteseMarshalleseMenomineeMexicanMexican American IndianMongolianMoroccanNative HawaiianNavajoNepaleseNew ZealanderNicaraguanNigerianNorthern EuropeanNorwegianOkinawanOsageOttawaPaiutePakistaniPalestinianPanamanianParaguayanPennsylvania GermanPeruvianPimaPolishPortuguesePotawatomiPuebloPuerto RicanPuget Sound SalishRomanianRussianSalvadoranSamoanScandinavianScotch-IrishScottishSeminoleSenegaleseSerbianShoshoneSierra LeoneanSiouxSlavicSlovakSloveneSomaliSouth AfricanSouth AmericanSouth American IndianSoviet UnionSpaniardSpanishSpanish AmericanSpanish American IndianSri LankanSubsaharan AfricanSudaneseSwedishSwissSyrianTaiwaneseThaiTlingit-HaidaTohono O'OdhamTonganTrinidadian and TobagonianTsimshianTurkishU.S. Virgin IslanderUgandanUkrainianUruguayanUteVenezuelanVietnameseWelshWest IndianYakamaYaquiYugoslavianYumanYup'ikZimbabwean
Immigration
NonimmigrantsImmigrantsAfghanistanAfricaAlbaniaArgentinaArmeniaAsiaAustraliaAustriaBahamasBangladeshBarbadosBelarusBelgiumBelizeBoliviaBosnia and HerzegovinaBrazilBulgariaBurma/MyanmarCabo VerdeCambodiaCameroonCanadaCaribbeanCentral AmericaChileChinaColombiaCongoCosta RicaCroatiaCubaCzechoslovakiaDenmarkDominicaDominican RepublicEastern AfricaEastern AsiaEastern EuropeEcuadorEgyptEnglandEritreaEthiopiaEuropeFijiFranceGermanyGhanaGreeceGrenadaGuatemalaGuyanaHaitiHondurasHong KongHungaryIndiaIndonesiaIranIraqIrelandIsraelItalyJamaicaJapanJordanKazakhstanKenyaKoreaKuwaitLaosLatin AmericaLatviaLebanonLiberiaLithuaniaMalaysiaMexicoMicronesiaMiddle AfricaMoldovaMoroccoNepalNetherlandsNicaraguaNigeriaNorth AmericaNorth MacedoniaNorthern AfricaNorthern EuropeNorwayOceaniaPakistanPanamaPeruPhilippinesPolandPortugalRomaniaRussiaSaudi ArabiaScotlandSenegalSerbiaSierra LeoneSingaporeSomaliaSouth AfricaSouth AmericaSouth Central AsiaSouth Eastern AsiaSouthern EuropeSpainSri LankaSt. Vincent and the GrenadinesSudanSwedenSwitzerlandSyriaTaiwanThailandTrinidad and TobagoTurkeyUgandaUkraineUruguayUzbekistanVenezuelaVietnamWest IndiesWestern AfricaWestern AsiaWestern EuropeYemenZaireZimbabweAzores
Immigrants from El Salvador
Race
Ancestry
AfghanAfricanAlaska NativeAlaskan AthabascanAlbanianAleutAlsatianAmericanApacheArabArapahoArgentineanArmenianAssyrian/Chaldean/SyriacAustralianAustrianBahamianBangladeshiBarbadianBasqueBelgianBelizeanBermudanBhutaneseBlackfeetBolivianBrazilianBritishBritish West IndianBulgarianBurmeseCajunCambodianCanadianCape VerdeanCarpatho RusynCelticCentral AmericanCentral American IndianCherokeeCheyenneChickasawChileanChineseChippewaChoctawColombianColvilleComancheCosta RicanCreeCreekCroatianCrowCubanCypriotCzechCzechoslovakianDanishDelawareDominicanDutchDutch West IndianEastern EuropeanEcuadorianEgyptianEnglishEstonianEthiopianEuropeanFijianFilipinoFinnishFrenchFrench American IndianFrench CanadianGermanGerman RussianGhanaianGreekGuamanian/ChamorroGuatemalanGuyaneseHaitianHmongHonduranHopiHoumaHungarianIndian (Asian)IndonesianInupiatIranianIraqiIrishIroquoisIsraeliItalianJamaicanJapaneseJordanianKenyanKiowaKoreanLaotianLatvianLebaneseLiberianLithuanianLumbeeLuxembourgerMacedonianMalaysianMalteseMarshalleseMenomineeMexicanMexican American IndianMongolianMoroccanNative HawaiianNavajoNepaleseNew ZealanderNicaraguanNigerianNorthern EuropeanNorwegianOkinawanOsageOttawaPaiutePakistaniPalestinianPanamanianParaguayanPennsylvania GermanPeruvianPimaPolishPortuguesePotawatomiPuebloPuerto RicanPuget Sound SalishRomanianRussianSalvadoranSamoanScandinavianScotch-IrishScottishSeminoleSenegaleseSerbianShoshoneSierra LeoneanSiouxSlavicSlovakSloveneSomaliSouth AfricanSouth AmericanSouth American IndianSoviet UnionSpaniardSpanishSpanish AmericanSpanish American IndianSri LankanSubsaharan AfricanSudaneseSwedishSwissSyrianTaiwaneseThaiTlingit-HaidaTohono O'OdhamTonganTrinidadian and TobagonianTsimshianTurkishU.S. Virgin IslanderUgandanUkrainianUruguayanUteVenezuelanVietnameseWelshWest IndianYakamaYaquiYugoslavianYumanYup'ikZimbabwean
Immigration
NonimmigrantsImmigrantsAfghanistanAfricaAlbaniaArgentinaArmeniaAsiaAustraliaAustriaBahamasBangladeshBarbadosBelarusBelgiumBelizeBoliviaBosnia and HerzegovinaBrazilBulgariaBurma/MyanmarCabo VerdeCambodiaCameroonCanadaCaribbeanCentral AmericaChileChinaColombiaCongoCosta RicaCroatiaCubaCzechoslovakiaDenmarkDominicaDominican RepublicEastern AfricaEastern AsiaEastern EuropeEcuadorEgyptEl SalvadorEnglandEritreaEthiopiaEuropeFijiFranceGermanyGhanaGreeceGrenadaGuatemalaGuyanaHaitiHondurasHong KongHungaryIndiaIndonesiaIranIraqIrelandIsraelItalyJamaicaJapanJordanKazakhstanKenyaKoreaKuwaitLaosLatin AmericaLatviaLebanonLiberiaLithuaniaMalaysiaMexicoMicronesiaMiddle AfricaMoldovaMoroccoNepalNetherlandsNicaraguaNigeriaNorth AmericaNorth MacedoniaNorthern AfricaNorthern EuropeNorwayOceaniaPakistanPanamaPeruPhilippinesPolandPortugalRomaniaRussiaSaudi ArabiaScotlandSenegalSerbiaSierra LeoneSingaporeSomaliaSouth AfricaSouth AmericaSouth Central AsiaSouth Eastern AsiaSouthern EuropeSpainSri LankaSt. Vincent and the GrenadinesSudanSwedenSwitzerlandSyriaTaiwanThailandTrinidad and TobagoTurkeyUgandaUkraineUruguayUzbekistanVenezuelaVietnamWest IndiesWestern AfricaWestern AsiaWestern EuropeYemenZaireZimbabweAzores
Child Poverty Among Boys Under 16
Income
Poverty
Unemployment
Labor Participation
Family Structure
Vehicle Availability
Education Level
Disability

Child Poverty Among Boys Under 16 Comparison

Icelanders

Immigrants from El Salvador

Excellent
Tragic
15.5%
CHILD POVERTY AMONG BOYS UNDER 16
87.5/ 100
METRIC RATING
136th/ 347
METRIC RANK
19.6%
CHILD POVERTY AMONG BOYS UNDER 16
0.1/ 100
METRIC RATING
266th/ 347
METRIC RANK

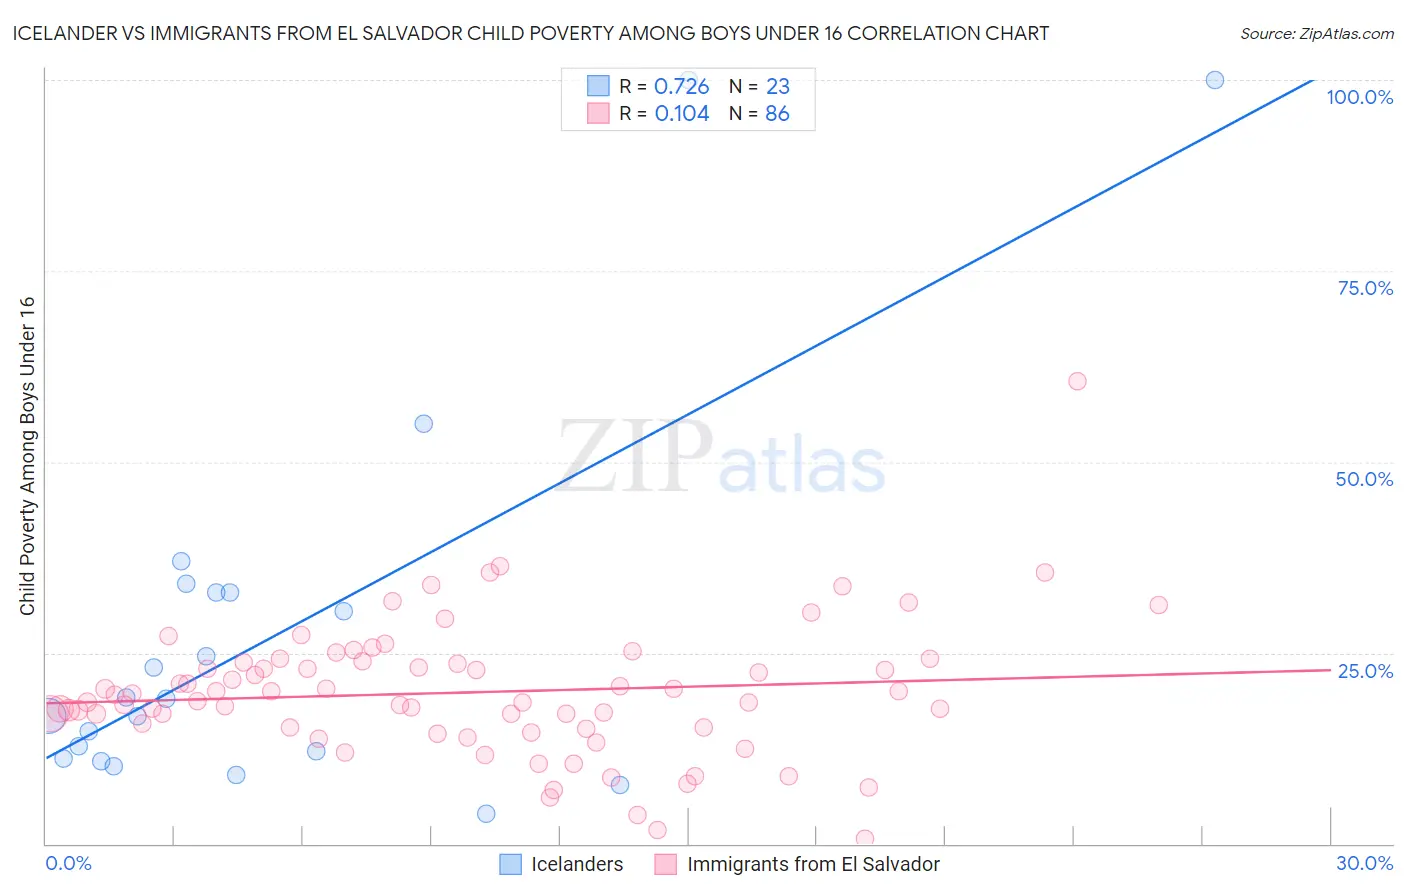
Icelander vs Immigrants from El Salvador Child Poverty Among Boys Under 16 Correlation Chart

The statistical analysis conducted on geographies consisting of 158,023,783 people shows a strong positive correlation between the proportion of Icelanders and poverty level among boys under the age of 16 in the United States with a correlation coefficient (R) of 0.726 and weighted average of 15.5%. Similarly, the statistical analysis conducted on geographies consisting of 354,572,517 people shows a poor positive correlation between the proportion of Immigrants from El Salvador and poverty level among boys under the age of 16 in the United States with a correlation coefficient (R) of 0.104 and weighted average of 19.6%, a difference of 26.1%.
Icelander vs Immigrants from El Salvador Child Poverty Among Boys Under 16

Child Poverty Among Boys Under 16 Correlation Summary

MeasurementIcelanderImmigrants from El Salvador
Minimum3.9%0.59%
Maximum100.0%60.6%
Range96.1%60.0%
Mean27.6%19.8%
Median18.9%19.1%
Interquartile 25% (IQ1)11.2%15.2%
Interquartile 75% (IQ3)33.0%23.7%
Interquartile Range (IQR)21.8%8.4%
Standard Deviation (Sample)25.8%8.8%
Standard Deviation (Population)25.2%8.7%

Similar Demographics by Child Poverty Among Boys Under 16

Demographics Similar to Icelanders by Child Poverty Among Boys Under 16

In terms of child poverty among boys under 16, the demographic groups most similar to Icelanders are Portuguese (15.5%, a difference of 0.010%), Immigrants from Spain (15.6%, a difference of 0.10%), Peruvian (15.5%, a difference of 0.19%), Welsh (15.5%, a difference of 0.23%), and Immigrants from Southern Europe (15.6%, a difference of 0.25%).
DemographicsRating | RankChild Poverty Among Boys Under 16
Immigrants | Brazil
90.3
/100
|
#129
Exceptional
15.4%
Mongolians
90.2
/100
|
#130
Exceptional
15.4%
Immigrants | Western Europe
90.0
/100
|
#131
Exceptional
15.4%
Immigrants | Kazakhstan
88.7
/100
|
#132
Excellent
15.5%
Welsh
88.3
/100
|
#133
Excellent
15.5%
Peruvians
88.1
/100
|
#134
Excellent
15.5%
Portuguese
87.5
/100
|
#135
Excellent
15.5%
Icelanders
87.5
/100
|
#136
Excellent
15.5%
Immigrants | Spain
87.1
/100
|
#137
Excellent
15.6%
Immigrants | Southern Europe
86.5
/100
|
#138
Excellent
15.6%
Albanians
86.5
/100
|
#139
Excellent
15.6%
Immigrants | Kuwait
85.6
/100
|
#140
Excellent
15.6%
Slavs
84.5
/100
|
#141
Excellent
15.7%
Immigrants | Hungary
84.1
/100
|
#142
Excellent
15.7%
Immigrants | Fiji
83.6
/100
|
#143
Excellent
15.7%

Demographics Similar to Immigrants from El Salvador by Child Poverty Among Boys Under 16

In terms of child poverty among boys under 16, the demographic groups most similar to Immigrants from El Salvador are Vietnamese (19.6%, a difference of 0.010%), Guyanese (19.6%, a difference of 0.040%), Spanish American Indian (19.6%, a difference of 0.12%), Iroquois (19.6%, a difference of 0.14%), and Immigrants from Cabo Verde (19.7%, a difference of 0.29%).
DemographicsRating | RankChild Poverty Among Boys Under 16
Spanish Americans
0.2
/100
|
#259
Tragic
19.4%
Shoshone
0.2
/100
|
#260
Tragic
19.4%
Immigrants | Ghana
0.2
/100
|
#261
Tragic
19.4%
Immigrants | Guyana
0.1
/100
|
#262
Tragic
19.5%
Ottawa
0.1
/100
|
#263
Tragic
19.5%
Iroquois
0.1
/100
|
#264
Tragic
19.6%
Guyanese
0.1
/100
|
#265
Tragic
19.6%
Immigrants | El Salvador
0.1
/100
|
#266
Tragic
19.6%
Vietnamese
0.1
/100
|
#267
Tragic
19.6%
Spanish American Indians
0.1
/100
|
#268
Tragic
19.6%
Immigrants | Cabo Verde
0.1
/100
|
#269
Tragic
19.7%
Cherokee
0.1
/100
|
#270
Tragic
19.7%
Chickasaw
0.1
/100
|
#271
Tragic
19.8%
Immigrants | Ecuador
0.1
/100
|
#272
Tragic
19.8%
Belizeans
0.1
/100
|
#273
Tragic
19.9%