Soviet Union vs French American Indian Single Father Poverty
COMPARE
Soviet Union
French American Indian
Single Father Poverty
Single Father Poverty Comparison
Soviet Union
French American Indians
14.3%
SINGLE FATHER POVERTY
100.0/ 100
METRIC RATING
18th/ 347
METRIC RANK
17.4%
SINGLE FATHER POVERTY
0.2/ 100
METRIC RATING
271st/ 347
METRIC RANK
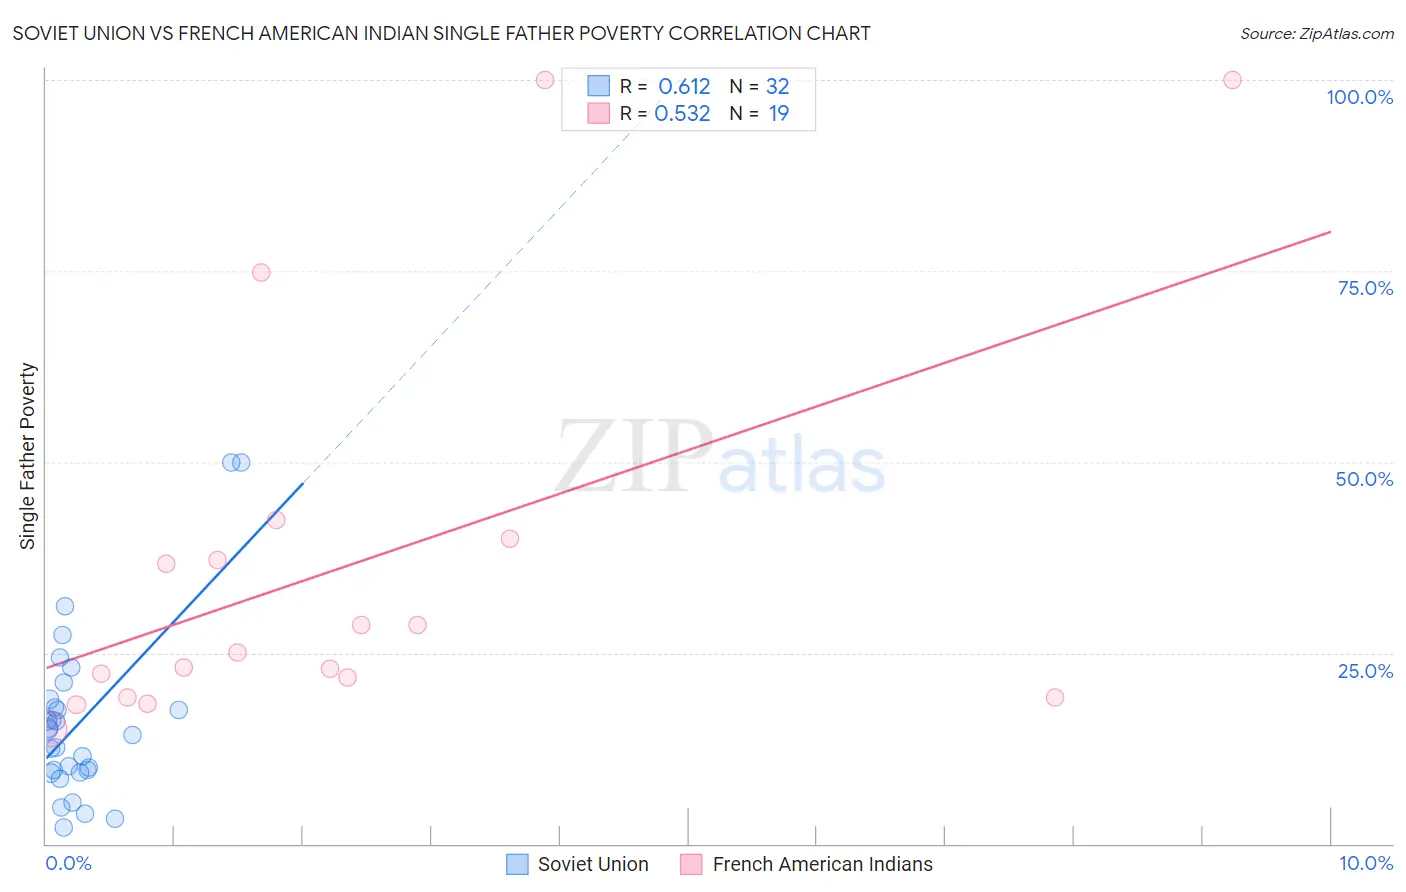
Soviet Union vs French American Indian Single Father Poverty Correlation Chart
The statistical analysis conducted on geographies consisting of 41,440,473 people shows a significant positive correlation between the proportion of Soviet Union and poverty level among single fathers in the United States with a correlation coefficient (R) of 0.612 and weighted average of 14.3%. Similarly, the statistical analysis conducted on geographies consisting of 117,658,410 people shows a substantial positive correlation between the proportion of French American Indians and poverty level among single fathers in the United States with a correlation coefficient (R) of 0.532 and weighted average of 17.4%, a difference of 22.3%.
Single Father Poverty Correlation Summary
| Measurement | Soviet Union | French American Indian |
| Minimum | 2.1% | 15.1% |
| Maximum | 50.0% | 100.0% |
| Range | 47.9% | 84.9% |
| Mean | 16.1% | 36.5% |
| Median | 14.6% | 25.0% |
| Interquartile 25% (IQ1) | 9.5% | 19.2% |
| Interquartile 75% (IQ3) | 18.4% | 40.0% |
| Interquartile Range (IQR) | 8.9% | 20.8% |
| Standard Deviation (Sample) | 11.2% | 26.2% |
| Standard Deviation (Population) | 11.1% | 25.5% |
Similar Demographics by Single Father Poverty
Demographics Similar to Soviet Union by Single Father Poverty
In terms of single father poverty, the demographic groups most similar to Soviet Union are Immigrants from Hong Kong (14.2%, a difference of 0.030%), Immigrants from Iraq (14.3%, a difference of 0.040%), Immigrants from Singapore (14.3%, a difference of 0.090%), Immigrants from Afghanistan (14.3%, a difference of 0.18%), and Immigrants from Iran (14.2%, a difference of 0.48%).
| Demographics | Rating | Rank | Single Father Poverty |
| Filipinos | 100.0 /100 | #11 | Exceptional 14.0% |
| Immigrants | India | 100.0 /100 | #12 | Exceptional 14.0% |
| Immigrants | Philippines | 100.0 /100 | #13 | Exceptional 14.0% |
| Immigrants | Vietnam | 100.0 /100 | #14 | Exceptional 14.1% |
| Sri Lankans | 100.0 /100 | #15 | Exceptional 14.2% |
| Immigrants | Iran | 100.0 /100 | #16 | Exceptional 14.2% |
| Immigrants | Hong Kong | 100.0 /100 | #17 | Exceptional 14.2% |
| Soviet Union | 100.0 /100 | #18 | Exceptional 14.3% |
| Immigrants | Iraq | 100.0 /100 | #19 | Exceptional 14.3% |
| Immigrants | Singapore | 100.0 /100 | #20 | Exceptional 14.3% |
| Immigrants | Afghanistan | 100.0 /100 | #21 | Exceptional 14.3% |
| Taiwanese | 100.0 /100 | #22 | Exceptional 14.3% |
| Immigrants | Egypt | 100.0 /100 | #23 | Exceptional 14.4% |
| Immigrants | South Eastern Asia | 100.0 /100 | #24 | Exceptional 14.4% |
| Iranians | 100.0 /100 | #25 | Exceptional 14.4% |
Demographics Similar to French American Indians by Single Father Poverty
In terms of single father poverty, the demographic groups most similar to French American Indians are Indonesian (17.4%, a difference of 0.14%), Barbadian (17.5%, a difference of 0.35%), Slavic (17.4%, a difference of 0.40%), Immigrants from Caribbean (17.4%, a difference of 0.47%), and Haitian (17.3%, a difference of 0.57%).
| Demographics | Rating | Rank | Single Father Poverty |
| Slovenes | 0.3 /100 | #264 | Tragic 17.3% |
| Poles | 0.3 /100 | #265 | Tragic 17.3% |
| Jamaicans | 0.3 /100 | #266 | Tragic 17.3% |
| Haitians | 0.3 /100 | #267 | Tragic 17.3% |
| Immigrants | Caribbean | 0.3 /100 | #268 | Tragic 17.4% |
| Slavs | 0.3 /100 | #269 | Tragic 17.4% |
| Indonesians | 0.2 /100 | #270 | Tragic 17.4% |
| French American Indians | 0.2 /100 | #271 | Tragic 17.4% |
| Barbadians | 0.1 /100 | #272 | Tragic 17.5% |
| Italians | 0.1 /100 | #273 | Tragic 17.5% |
| Macedonians | 0.1 /100 | #274 | Tragic 17.7% |
| British West Indians | 0.0 /100 | #275 | Tragic 17.7% |
| German Russians | 0.0 /100 | #276 | Tragic 17.7% |
| Lebanese | 0.0 /100 | #277 | Tragic 17.7% |
| Germans | 0.0 /100 | #278 | Tragic 17.7% |