American vs French American Indian Single Father Poverty
COMPARE
American
French American Indian
Single Father Poverty
Single Father Poverty Comparison
Americans
French American Indians
20.1%
SINGLE FATHER POVERTY
0.0/ 100
METRIC RATING
324th/ 347
METRIC RANK
17.4%
SINGLE FATHER POVERTY
0.2/ 100
METRIC RATING
271st/ 347
METRIC RANK
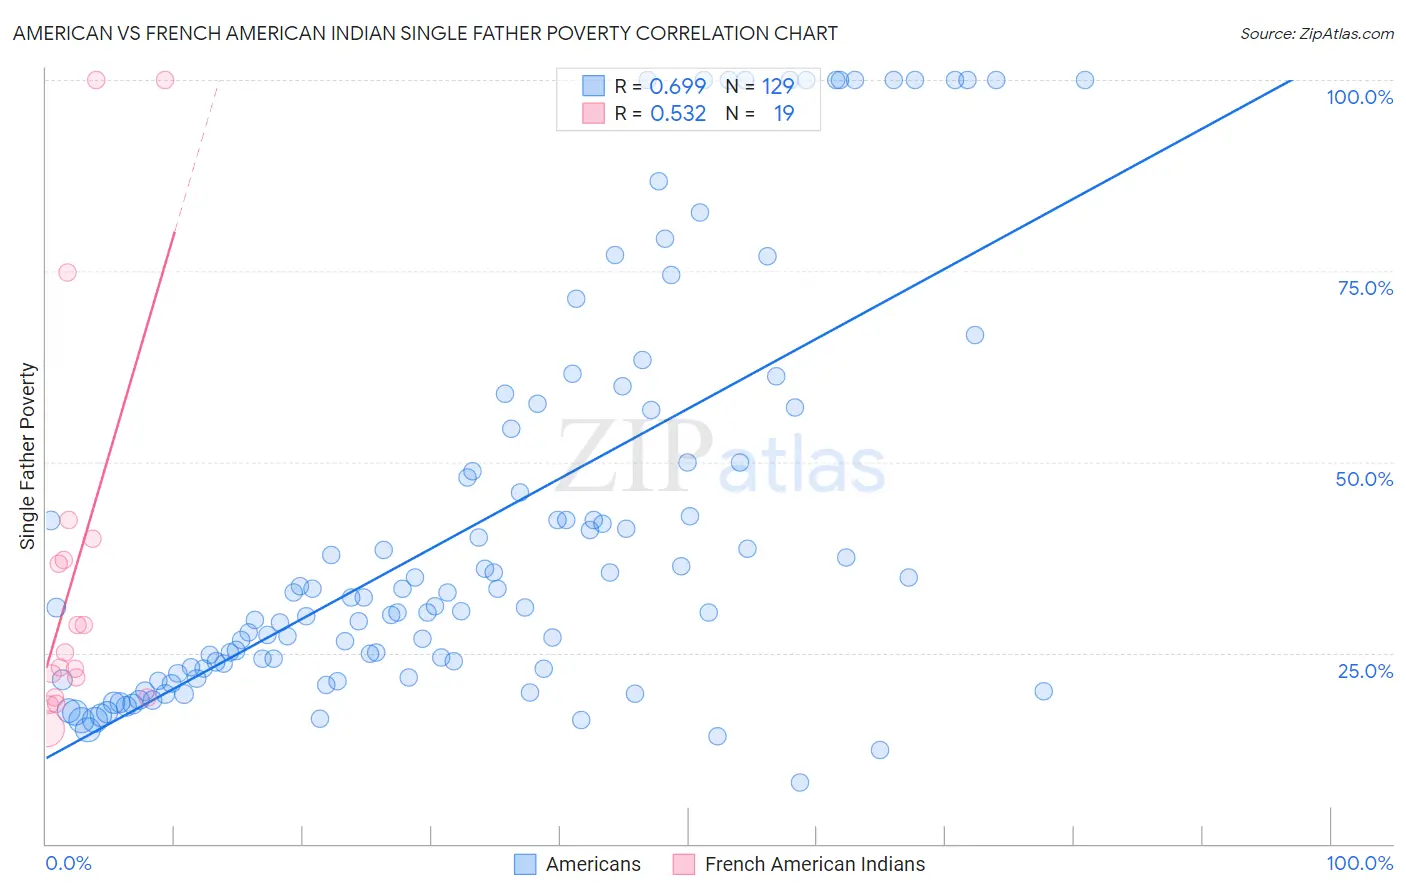
American vs French American Indian Single Father Poverty Correlation Chart
The statistical analysis conducted on geographies consisting of 414,003,913 people shows a significant positive correlation between the proportion of Americans and poverty level among single fathers in the United States with a correlation coefficient (R) of 0.699 and weighted average of 20.1%. Similarly, the statistical analysis conducted on geographies consisting of 117,658,410 people shows a substantial positive correlation between the proportion of French American Indians and poverty level among single fathers in the United States with a correlation coefficient (R) of 0.532 and weighted average of 17.4%, a difference of 15.1%.
Single Father Poverty Correlation Summary
| Measurement | American | French American Indian |
| Minimum | 8.0% | 15.1% |
| Maximum | 100.0% | 100.0% |
| Range | 92.0% | 84.9% |
| Mean | 41.6% | 36.5% |
| Median | 31.1% | 25.0% |
| Interquartile 25% (IQ1) | 22.6% | 19.2% |
| Interquartile 75% (IQ3) | 52.2% | 40.0% |
| Interquartile Range (IQR) | 29.6% | 20.8% |
| Standard Deviation (Sample) | 26.6% | 26.2% |
| Standard Deviation (Population) | 26.5% | 25.5% |
Similar Demographics by Single Father Poverty
Demographics Similar to Americans by Single Father Poverty
In terms of single father poverty, the demographic groups most similar to Americans are Pennsylvania German (20.0%, a difference of 0.22%), Creek (19.8%, a difference of 1.1%), Black/African American (20.4%, a difference of 1.6%), Cherokee (19.6%, a difference of 2.1%), and Immigrants from Yemen (20.6%, a difference of 2.6%).
| Demographics | Rating | Rank | Single Father Poverty |
| Dominicans | 0.0 /100 | #317 | Tragic 19.1% |
| Dutch West Indians | 0.0 /100 | #318 | Tragic 19.2% |
| Slovaks | 0.0 /100 | #319 | Tragic 19.3% |
| Inupiat | 0.0 /100 | #320 | Tragic 19.5% |
| Cherokee | 0.0 /100 | #321 | Tragic 19.6% |
| Creek | 0.0 /100 | #322 | Tragic 19.8% |
| Pennsylvania Germans | 0.0 /100 | #323 | Tragic 20.0% |
| Americans | 0.0 /100 | #324 | Tragic 20.1% |
| Blacks/African Americans | 0.0 /100 | #325 | Tragic 20.4% |
| Immigrants | Yemen | 0.0 /100 | #326 | Tragic 20.6% |
| Choctaw | 0.0 /100 | #327 | Tragic 20.7% |
| Pueblo | 0.0 /100 | #328 | Tragic 21.1% |
| Colville | 0.0 /100 | #329 | Tragic 21.4% |
| Paiute | 0.0 /100 | #330 | Tragic 21.6% |
| Central American Indians | 0.0 /100 | #331 | Tragic 21.7% |
Demographics Similar to French American Indians by Single Father Poverty
In terms of single father poverty, the demographic groups most similar to French American Indians are Indonesian (17.4%, a difference of 0.14%), Barbadian (17.5%, a difference of 0.35%), Slavic (17.4%, a difference of 0.40%), Immigrants from Caribbean (17.4%, a difference of 0.47%), and Haitian (17.3%, a difference of 0.57%).
| Demographics | Rating | Rank | Single Father Poverty |
| Slovenes | 0.3 /100 | #264 | Tragic 17.3% |
| Poles | 0.3 /100 | #265 | Tragic 17.3% |
| Jamaicans | 0.3 /100 | #266 | Tragic 17.3% |
| Haitians | 0.3 /100 | #267 | Tragic 17.3% |
| Immigrants | Caribbean | 0.3 /100 | #268 | Tragic 17.4% |
| Slavs | 0.3 /100 | #269 | Tragic 17.4% |
| Indonesians | 0.2 /100 | #270 | Tragic 17.4% |
| French American Indians | 0.2 /100 | #271 | Tragic 17.4% |
| Barbadians | 0.1 /100 | #272 | Tragic 17.5% |
| Italians | 0.1 /100 | #273 | Tragic 17.5% |
| Macedonians | 0.1 /100 | #274 | Tragic 17.7% |
| British West Indians | 0.0 /100 | #275 | Tragic 17.7% |
| German Russians | 0.0 /100 | #276 | Tragic 17.7% |
| Lebanese | 0.0 /100 | #277 | Tragic 17.7% |
| Germans | 0.0 /100 | #278 | Tragic 17.7% |