South American Indian vs Immigrants from Oceania Female Poverty Among 18-24 Year Olds
COMPARE
South American Indian
Immigrants from Oceania
Female Poverty Among 18-24 Year Olds
Female Poverty Among 18-24 Year Olds Comparison
South American Indians
Immigrants from Oceania
20.1%
FEMALE POVERTY AMONG 18-24 YEAR OLDS
48.4/ 100
METRIC RATING
175th/ 347
METRIC RANK
19.7%
FEMALE POVERTY AMONG 18-24 YEAR OLDS
81.2/ 100
METRIC RATING
149th/ 347
METRIC RANK
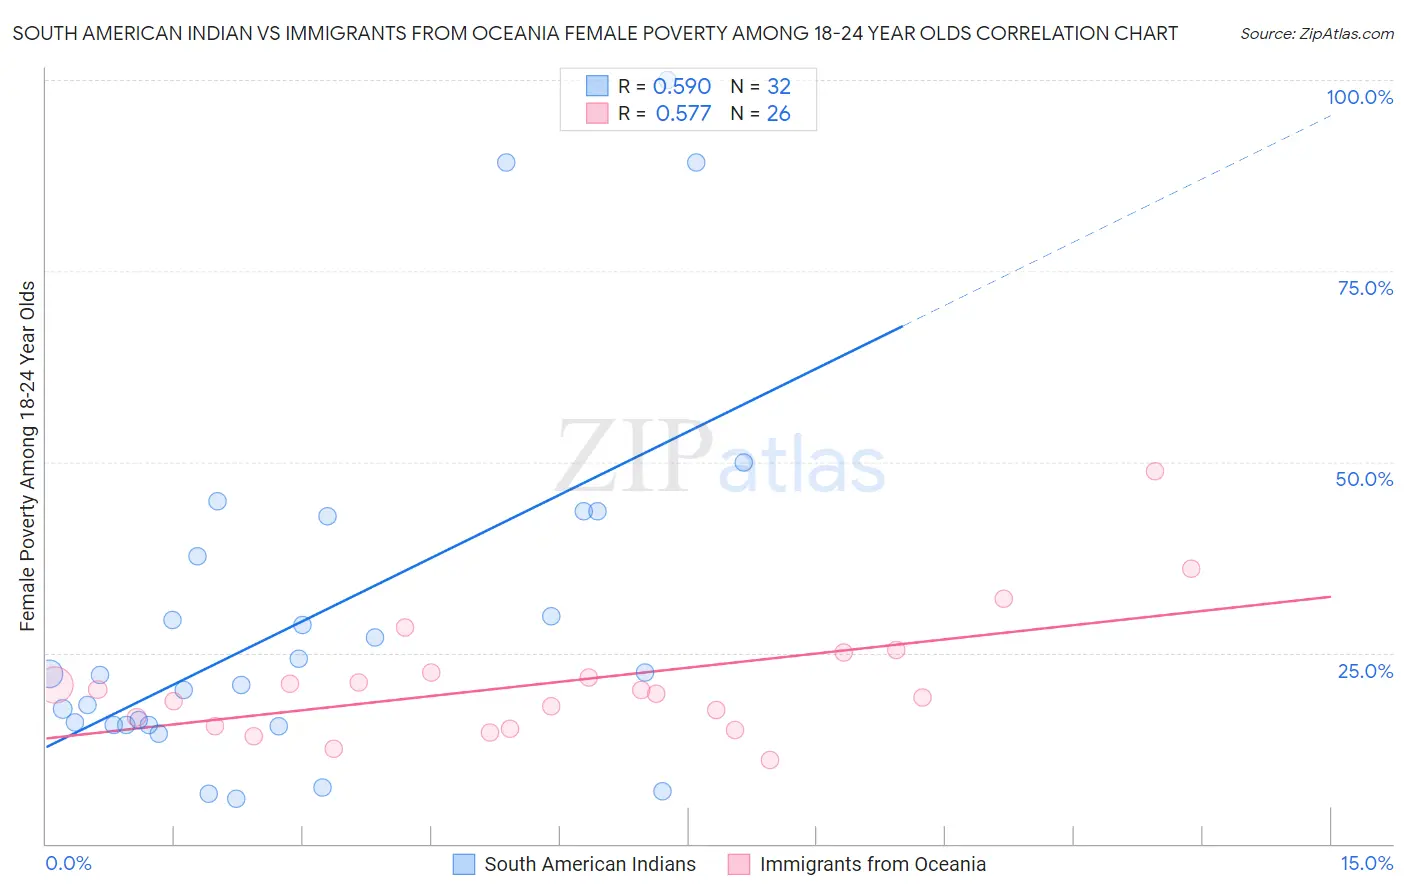
South American Indian vs Immigrants from Oceania Female Poverty Among 18-24 Year Olds Correlation Chart
The statistical analysis conducted on geographies consisting of 163,267,304 people shows a substantial positive correlation between the proportion of South American Indians and poverty level among females between the ages 18 and 24 in the United States with a correlation coefficient (R) of 0.590 and weighted average of 20.1%. Similarly, the statistical analysis conducted on geographies consisting of 299,979,017 people shows a substantial positive correlation between the proportion of Immigrants from Oceania and poverty level among females between the ages 18 and 24 in the United States with a correlation coefficient (R) of 0.577 and weighted average of 19.7%, a difference of 1.9%.
Female Poverty Among 18-24 Year Olds Correlation Summary
| Measurement | South American Indian | Immigrants from Oceania |
| Minimum | 5.9% | 10.9% |
| Maximum | 100.0% | 48.8% |
| Range | 94.1% | 37.9% |
| Mean | 29.9% | 21.1% |
| Median | 22.2% | 19.8% |
| Interquartile 25% (IQ1) | 15.6% | 15.3% |
| Interquartile 75% (IQ3) | 40.3% | 22.4% |
| Interquartile Range (IQR) | 24.7% | 7.0% |
| Standard Deviation (Sample) | 23.7% | 8.1% |
| Standard Deviation (Population) | 23.4% | 7.9% |
Similar Demographics by Female Poverty Among 18-24 Year Olds
Demographics Similar to South American Indians by Female Poverty Among 18-24 Year Olds
In terms of female poverty among 18-24 year olds, the demographic groups most similar to South American Indians are Irish (20.1%, a difference of 0.080%), Swedish (20.1%, a difference of 0.080%), Kenyan (20.2%, a difference of 0.17%), Belizean (20.1%, a difference of 0.18%), and Immigrants from Kazakhstan (20.2%, a difference of 0.21%).
| Demographics | Rating | Rank | Female Poverty Among 18-24 Year Olds |
| Fijians | 59.1 /100 | #168 | Average 20.0% |
| Hmong | 55.4 /100 | #169 | Average 20.0% |
| Iranians | 54.7 /100 | #170 | Average 20.1% |
| Immigrants | Nigeria | 54.3 /100 | #171 | Average 20.1% |
| Belizeans | 52.0 /100 | #172 | Average 20.1% |
| Irish | 50.0 /100 | #173 | Average 20.1% |
| Swedes | 50.0 /100 | #174 | Average 20.1% |
| South American Indians | 48.4 /100 | #175 | Average 20.1% |
| Kenyans | 44.9 /100 | #176 | Average 20.2% |
| Immigrants | Kazakhstan | 44.2 /100 | #177 | Average 20.2% |
| Swiss | 44.0 /100 | #178 | Average 20.2% |
| Ethiopians | 43.8 /100 | #179 | Average 20.2% |
| Iraqis | 43.3 /100 | #180 | Average 20.2% |
| Immigrants | China | 43.0 /100 | #181 | Average 20.2% |
| Immigrants | Barbados | 42.8 /100 | #182 | Average 20.2% |
Demographics Similar to Immigrants from Oceania by Female Poverty Among 18-24 Year Olds
In terms of female poverty among 18-24 year olds, the demographic groups most similar to Immigrants from Oceania are Immigrants from Latin America (19.7%, a difference of 0.010%), Syrian (19.8%, a difference of 0.080%), Immigrants from Eastern Asia (19.8%, a difference of 0.12%), Immigrants from Austria (19.7%, a difference of 0.16%), and Yugoslavian (19.8%, a difference of 0.17%).
| Demographics | Rating | Rank | Female Poverty Among 18-24 Year Olds |
| Panamanians | 84.6 /100 | #142 | Excellent 19.7% |
| Slavs | 84.4 /100 | #143 | Excellent 19.7% |
| Immigrants | Northern Africa | 84.1 /100 | #144 | Excellent 19.7% |
| Canadians | 83.8 /100 | #145 | Excellent 19.7% |
| Immigrants | Bosnia and Herzegovina | 83.6 /100 | #146 | Excellent 19.7% |
| Immigrants | Austria | 83.1 /100 | #147 | Excellent 19.7% |
| Immigrants | Latin America | 81.3 /100 | #148 | Excellent 19.7% |
| Immigrants | Oceania | 81.2 /100 | #149 | Excellent 19.7% |
| Syrians | 80.2 /100 | #150 | Excellent 19.8% |
| Immigrants | Eastern Asia | 79.7 /100 | #151 | Good 19.8% |
| Yugoslavians | 79.0 /100 | #152 | Good 19.8% |
| Immigrants | Japan | 78.1 /100 | #153 | Good 19.8% |
| Immigrants | Zimbabwe | 76.7 /100 | #154 | Good 19.8% |
| Hungarians | 76.6 /100 | #155 | Good 19.8% |
| Immigrants | Belgium | 76.4 /100 | #156 | Good 19.8% |