South American Indian vs Romanian Female Poverty Among 18-24 Year Olds
COMPARE
South American Indian
Romanian
Female Poverty Among 18-24 Year Olds
Female Poverty Among 18-24 Year Olds Comparison
South American Indians
Romanians
20.1%
FEMALE POVERTY AMONG 18-24 YEAR OLDS
48.4/ 100
METRIC RATING
175th/ 347
METRIC RANK
19.0%
FEMALE POVERTY AMONG 18-24 YEAR OLDS
98.9/ 100
METRIC RATING
91st/ 347
METRIC RANK
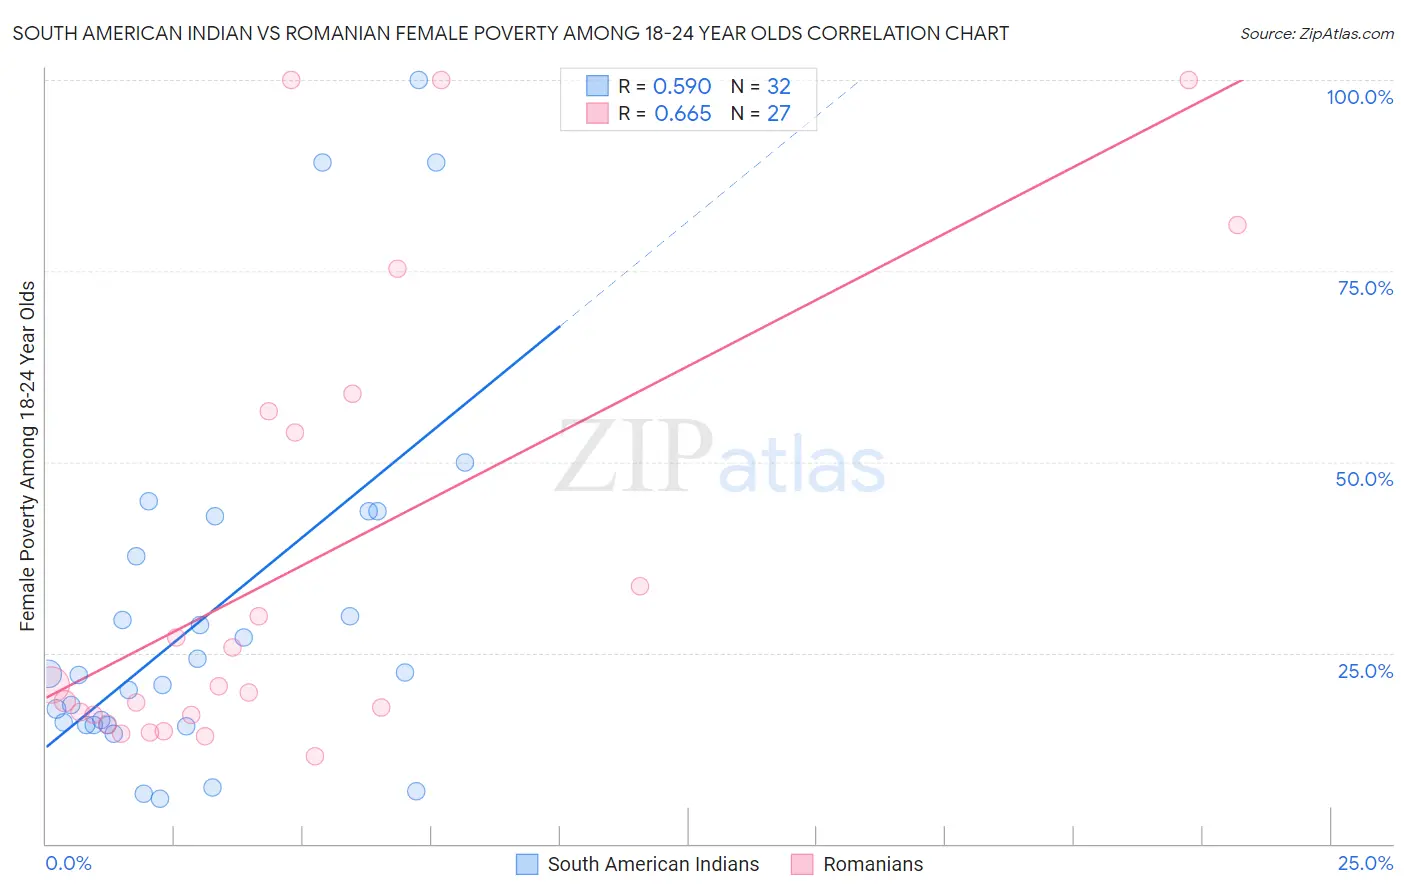
South American Indian vs Romanian Female Poverty Among 18-24 Year Olds Correlation Chart
The statistical analysis conducted on geographies consisting of 163,267,304 people shows a substantial positive correlation between the proportion of South American Indians and poverty level among females between the ages 18 and 24 in the United States with a correlation coefficient (R) of 0.590 and weighted average of 20.1%. Similarly, the statistical analysis conducted on geographies consisting of 367,156,694 people shows a significant positive correlation between the proportion of Romanians and poverty level among females between the ages 18 and 24 in the United States with a correlation coefficient (R) of 0.665 and weighted average of 19.0%, a difference of 6.0%.
Female Poverty Among 18-24 Year Olds Correlation Summary
| Measurement | South American Indian | Romanian |
| Minimum | 5.9% | 11.4% |
| Maximum | 100.0% | 100.0% |
| Range | 94.1% | 88.6% |
| Mean | 29.9% | 36.8% |
| Median | 22.2% | 20.7% |
| Interquartile 25% (IQ1) | 15.6% | 16.8% |
| Interquartile 75% (IQ3) | 40.3% | 56.7% |
| Interquartile Range (IQR) | 24.7% | 39.9% |
| Standard Deviation (Sample) | 23.7% | 29.7% |
| Standard Deviation (Population) | 23.4% | 29.2% |
Similar Demographics by Female Poverty Among 18-24 Year Olds
Demographics Similar to South American Indians by Female Poverty Among 18-24 Year Olds
In terms of female poverty among 18-24 year olds, the demographic groups most similar to South American Indians are Irish (20.1%, a difference of 0.080%), Swedish (20.1%, a difference of 0.080%), Kenyan (20.2%, a difference of 0.17%), Belizean (20.1%, a difference of 0.18%), and Immigrants from Kazakhstan (20.2%, a difference of 0.21%).
| Demographics | Rating | Rank | Female Poverty Among 18-24 Year Olds |
| Fijians | 59.1 /100 | #168 | Average 20.0% |
| Hmong | 55.4 /100 | #169 | Average 20.0% |
| Iranians | 54.7 /100 | #170 | Average 20.1% |
| Immigrants | Nigeria | 54.3 /100 | #171 | Average 20.1% |
| Belizeans | 52.0 /100 | #172 | Average 20.1% |
| Irish | 50.0 /100 | #173 | Average 20.1% |
| Swedes | 50.0 /100 | #174 | Average 20.1% |
| South American Indians | 48.4 /100 | #175 | Average 20.1% |
| Kenyans | 44.9 /100 | #176 | Average 20.2% |
| Immigrants | Kazakhstan | 44.2 /100 | #177 | Average 20.2% |
| Swiss | 44.0 /100 | #178 | Average 20.2% |
| Ethiopians | 43.8 /100 | #179 | Average 20.2% |
| Iraqis | 43.3 /100 | #180 | Average 20.2% |
| Immigrants | China | 43.0 /100 | #181 | Average 20.2% |
| Immigrants | Barbados | 42.8 /100 | #182 | Average 20.2% |
Demographics Similar to Romanians by Female Poverty Among 18-24 Year Olds
In terms of female poverty among 18-24 year olds, the demographic groups most similar to Romanians are Filipino (19.0%, a difference of 0.050%), Haitian (19.0%, a difference of 0.070%), Afghan (19.0%, a difference of 0.090%), Immigrants from Cabo Verde (19.0%, a difference of 0.12%), and Ukrainian (19.0%, a difference of 0.13%).
| Demographics | Rating | Rank | Female Poverty Among 18-24 Year Olds |
| Burmese | 99.2 /100 | #84 | Exceptional 18.9% |
| Immigrants | Armenia | 99.2 /100 | #85 | Exceptional 18.9% |
| Immigrants | Iraq | 99.2 /100 | #86 | Exceptional 18.9% |
| Immigrants | Jamaica | 99.2 /100 | #87 | Exceptional 18.9% |
| Croatians | 99.1 /100 | #88 | Exceptional 19.0% |
| Immigrants | Cabo Verde | 99.0 /100 | #89 | Exceptional 19.0% |
| Afghans | 99.0 /100 | #90 | Exceptional 19.0% |
| Romanians | 98.9 /100 | #91 | Exceptional 19.0% |
| Filipinos | 98.9 /100 | #92 | Exceptional 19.0% |
| Haitians | 98.9 /100 | #93 | Exceptional 19.0% |
| Ukrainians | 98.8 /100 | #94 | Exceptional 19.0% |
| Guamanians/Chamorros | 98.8 /100 | #95 | Exceptional 19.0% |
| Sierra Leoneans | 98.7 /100 | #96 | Exceptional 19.0% |
| Salvadorans | 98.4 /100 | #97 | Exceptional 19.1% |
| Immigrants | Jordan | 98.4 /100 | #98 | Exceptional 19.1% |