South American Indian vs Immigrants from Bulgaria Female Poverty Among 18-24 Year Olds
COMPARE
South American Indian
Immigrants from Bulgaria
Female Poverty Among 18-24 Year Olds
Female Poverty Among 18-24 Year Olds Comparison
South American Indians
Immigrants from Bulgaria
20.1%
FEMALE POVERTY AMONG 18-24 YEAR OLDS
48.4/ 100
METRIC RATING
175th/ 347
METRIC RANK
18.6%
FEMALE POVERTY AMONG 18-24 YEAR OLDS
99.7/ 100
METRIC RATING
69th/ 347
METRIC RANK
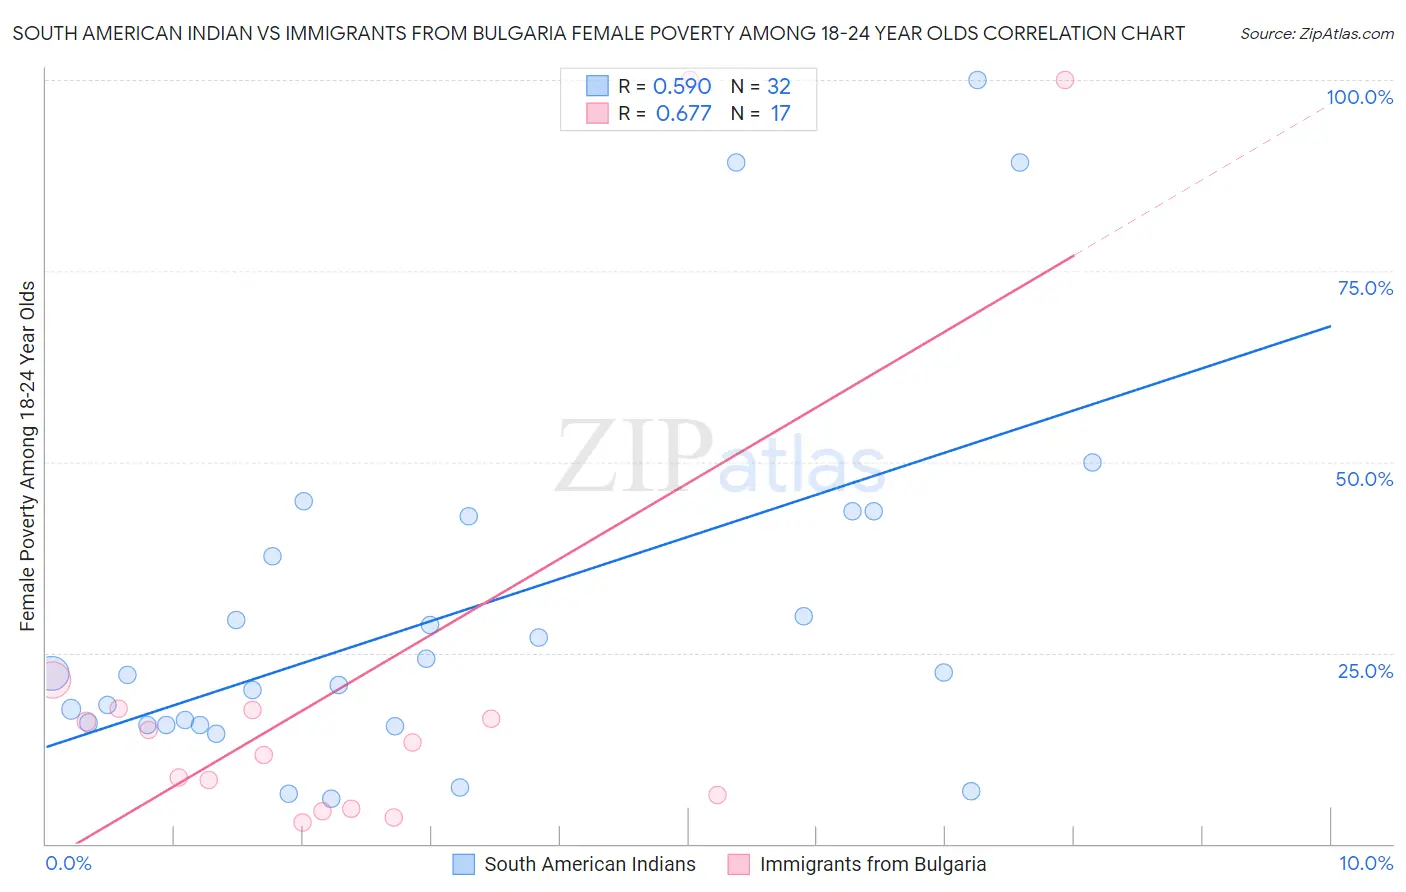
South American Indian vs Immigrants from Bulgaria Female Poverty Among 18-24 Year Olds Correlation Chart
The statistical analysis conducted on geographies consisting of 163,267,304 people shows a substantial positive correlation between the proportion of South American Indians and poverty level among females between the ages 18 and 24 in the United States with a correlation coefficient (R) of 0.590 and weighted average of 20.1%. Similarly, the statistical analysis conducted on geographies consisting of 170,683,117 people shows a significant positive correlation between the proportion of Immigrants from Bulgaria and poverty level among females between the ages 18 and 24 in the United States with a correlation coefficient (R) of 0.677 and weighted average of 18.6%, a difference of 7.9%.
Female Poverty Among 18-24 Year Olds Correlation Summary
| Measurement | South American Indian | Immigrants from Bulgaria |
| Minimum | 5.9% | 2.8% |
| Maximum | 100.0% | 100.0% |
| Range | 94.1% | 97.2% |
| Mean | 29.9% | 21.6% |
| Median | 22.2% | 13.3% |
| Interquartile 25% (IQ1) | 15.6% | 5.5% |
| Interquartile 75% (IQ3) | 40.3% | 17.6% |
| Interquartile Range (IQR) | 24.7% | 12.1% |
| Standard Deviation (Sample) | 23.7% | 30.0% |
| Standard Deviation (Population) | 23.4% | 29.1% |
Similar Demographics by Female Poverty Among 18-24 Year Olds
Demographics Similar to South American Indians by Female Poverty Among 18-24 Year Olds
In terms of female poverty among 18-24 year olds, the demographic groups most similar to South American Indians are Irish (20.1%, a difference of 0.080%), Swedish (20.1%, a difference of 0.080%), Kenyan (20.2%, a difference of 0.17%), Belizean (20.1%, a difference of 0.18%), and Immigrants from Kazakhstan (20.2%, a difference of 0.21%).
| Demographics | Rating | Rank | Female Poverty Among 18-24 Year Olds |
| Fijians | 59.1 /100 | #168 | Average 20.0% |
| Hmong | 55.4 /100 | #169 | Average 20.0% |
| Iranians | 54.7 /100 | #170 | Average 20.1% |
| Immigrants | Nigeria | 54.3 /100 | #171 | Average 20.1% |
| Belizeans | 52.0 /100 | #172 | Average 20.1% |
| Irish | 50.0 /100 | #173 | Average 20.1% |
| Swedes | 50.0 /100 | #174 | Average 20.1% |
| South American Indians | 48.4 /100 | #175 | Average 20.1% |
| Kenyans | 44.9 /100 | #176 | Average 20.2% |
| Immigrants | Kazakhstan | 44.2 /100 | #177 | Average 20.2% |
| Swiss | 44.0 /100 | #178 | Average 20.2% |
| Ethiopians | 43.8 /100 | #179 | Average 20.2% |
| Iraqis | 43.3 /100 | #180 | Average 20.2% |
| Immigrants | China | 43.0 /100 | #181 | Average 20.2% |
| Immigrants | Barbados | 42.8 /100 | #182 | Average 20.2% |
Demographics Similar to Immigrants from Bulgaria by Female Poverty Among 18-24 Year Olds
In terms of female poverty among 18-24 year olds, the demographic groups most similar to Immigrants from Bulgaria are Immigrants from Costa Rica (18.7%, a difference of 0.11%), Brazilian (18.6%, a difference of 0.12%), Immigrants from Korea (18.6%, a difference of 0.15%), Immigrants from Haiti (18.7%, a difference of 0.17%), and Armenian (18.7%, a difference of 0.19%).
| Demographics | Rating | Rank | Female Poverty Among 18-24 Year Olds |
| Greeks | 99.8 /100 | #62 | Exceptional 18.5% |
| Immigrants | Belarus | 99.8 /100 | #63 | Exceptional 18.5% |
| Immigrants | Asia | 99.8 /100 | #64 | Exceptional 18.6% |
| Immigrants | Scotland | 99.8 /100 | #65 | Exceptional 18.6% |
| Jordanians | 99.8 /100 | #66 | Exceptional 18.6% |
| Immigrants | Korea | 99.8 /100 | #67 | Exceptional 18.6% |
| Brazilians | 99.8 /100 | #68 | Exceptional 18.6% |
| Immigrants | Bulgaria | 99.7 /100 | #69 | Exceptional 18.6% |
| Immigrants | Costa Rica | 99.7 /100 | #70 | Exceptional 18.7% |
| Immigrants | Haiti | 99.7 /100 | #71 | Exceptional 18.7% |
| Armenians | 99.7 /100 | #72 | Exceptional 18.7% |
| Lithuanians | 99.7 /100 | #73 | Exceptional 18.7% |
| Hawaiians | 99.6 /100 | #74 | Exceptional 18.7% |
| Poles | 99.6 /100 | #75 | Exceptional 18.8% |
| Immigrants | Cambodia | 99.5 /100 | #76 | Exceptional 18.8% |