French American Indian vs Immigrants from Latvia Poverty
COMPARE
French American Indian
Immigrants from Latvia
Poverty
Poverty Comparison
French American Indians
Immigrants from Latvia
13.9%
POVERTY
0.5/ 100
METRIC RATING
237th/ 347
METRIC RANK
11.5%
POVERTY
94.5/ 100
METRIC RATING
98th/ 347
METRIC RANK
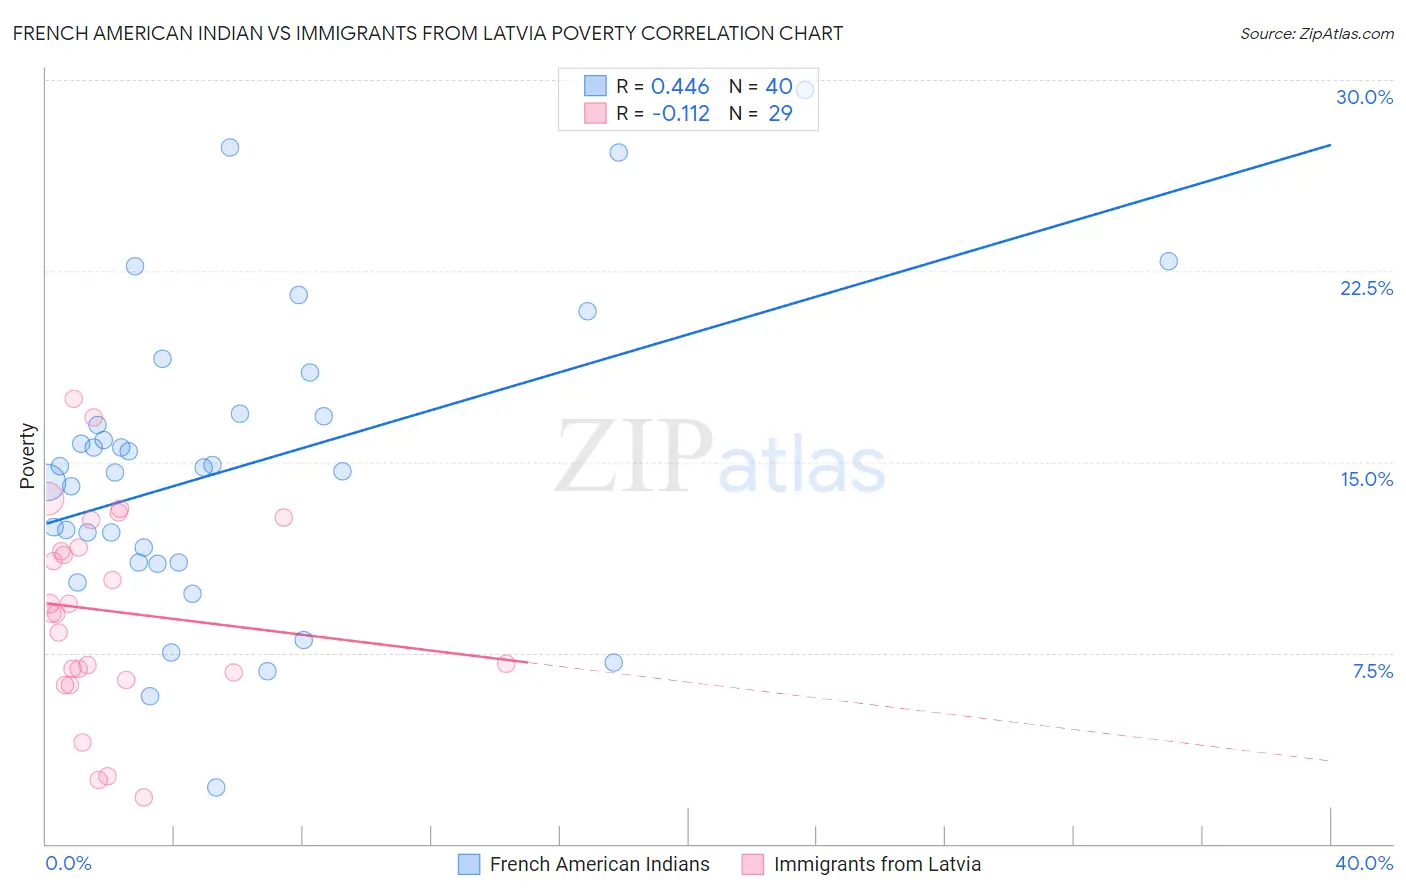
French American Indian vs Immigrants from Latvia Poverty Correlation Chart
The statistical analysis conducted on geographies consisting of 131,970,723 people shows a moderate positive correlation between the proportion of French American Indians and poverty level in the United States with a correlation coefficient (R) of 0.446 and weighted average of 13.9%. Similarly, the statistical analysis conducted on geographies consisting of 113,731,697 people shows a poor negative correlation between the proportion of Immigrants from Latvia and poverty level in the United States with a correlation coefficient (R) of -0.112 and weighted average of 11.5%, a difference of 21.0%.
Poverty Correlation Summary
| Measurement | French American Indian | Immigrants from Latvia |
| Minimum | 2.2% | 1.8% |
| Maximum | 29.6% | 17.5% |
| Range | 27.4% | 15.6% |
| Mean | 14.8% | 9.1% |
| Median | 14.7% | 9.1% |
| Interquartile 25% (IQ1) | 11.0% | 6.6% |
| Interquartile 75% (IQ3) | 16.8% | 12.2% |
| Interquartile Range (IQR) | 5.8% | 5.6% |
| Standard Deviation (Sample) | 5.9% | 4.0% |
| Standard Deviation (Population) | 5.9% | 3.9% |
Similar Demographics by Poverty
Demographics Similar to French American Indians by Poverty
In terms of poverty, the demographic groups most similar to French American Indians are Immigrants from Armenia (13.9%, a difference of 0.020%), Cuban (13.9%, a difference of 0.060%), Ghanaian (13.9%, a difference of 0.13%), Nicaraguan (13.9%, a difference of 0.48%), and Immigrants from Laos (13.8%, a difference of 0.49%).
| Demographics | Rating | Rank | Poverty |
| Alaskan Athabascans | 1.5 /100 | #230 | Tragic 13.6% |
| Nigerians | 1.4 /100 | #231 | Tragic 13.6% |
| Fijians | 0.8 /100 | #232 | Tragic 13.7% |
| Immigrants | Saudi Arabia | 0.8 /100 | #233 | Tragic 13.8% |
| Immigrants | Laos | 0.7 /100 | #234 | Tragic 13.8% |
| Cubans | 0.6 /100 | #235 | Tragic 13.9% |
| Immigrants | Armenia | 0.5 /100 | #236 | Tragic 13.9% |
| French American Indians | 0.5 /100 | #237 | Tragic 13.9% |
| Ghanaians | 0.5 /100 | #238 | Tragic 13.9% |
| Nicaraguans | 0.4 /100 | #239 | Tragic 13.9% |
| Immigrants | Middle Africa | 0.4 /100 | #240 | Tragic 14.0% |
| Salvadorans | 0.4 /100 | #241 | Tragic 14.0% |
| Ecuadorians | 0.4 /100 | #242 | Tragic 14.0% |
| Sudanese | 0.3 /100 | #243 | Tragic 14.0% |
| Nepalese | 0.3 /100 | #244 | Tragic 14.0% |
Demographics Similar to Immigrants from Latvia by Poverty
In terms of poverty, the demographic groups most similar to Immigrants from Latvia are Immigrants from Egypt (11.5%, a difference of 0.030%), Immigrants from South Africa (11.5%, a difference of 0.070%), Immigrants from Indonesia (11.5%, a difference of 0.14%), Paraguayan (11.4%, a difference of 0.19%), and Australian (11.4%, a difference of 0.19%).
| Demographics | Rating | Rank | Poverty |
| Finns | 95.2 /100 | #91 | Exceptional 11.4% |
| British | 95.0 /100 | #92 | Exceptional 11.4% |
| Romanians | 94.9 /100 | #93 | Exceptional 11.4% |
| Paraguayans | 94.9 /100 | #94 | Exceptional 11.4% |
| Australians | 94.9 /100 | #95 | Exceptional 11.4% |
| Immigrants | South Africa | 94.7 /100 | #96 | Exceptional 11.5% |
| Immigrants | Egypt | 94.6 /100 | #97 | Exceptional 11.5% |
| Immigrants | Latvia | 94.5 /100 | #98 | Exceptional 11.5% |
| Immigrants | Indonesia | 94.2 /100 | #99 | Exceptional 11.5% |
| Scottish | 94.0 /100 | #100 | Exceptional 11.5% |
| Slavs | 93.3 /100 | #101 | Exceptional 11.5% |
| Laotians | 92.4 /100 | #102 | Exceptional 11.6% |
| Okinawans | 92.4 /100 | #103 | Exceptional 11.6% |
| Native Hawaiians | 92.1 /100 | #104 | Exceptional 11.6% |
| Portuguese | 92.1 /100 | #105 | Exceptional 11.6% |