South African vs Costa Rican Receiving Food Stamps
COMPARE
South African
Costa Rican
Receiving Food Stamps
Receiving Food Stamps Comparison
South Africans
Costa Ricans
10.0%
RECEIVING FOOD STAMPS
98.7/ 100
METRIC RATING
78th/ 347
METRIC RANK
11.6%
RECEIVING FOOD STAMPS
57.9/ 100
METRIC RATING
170th/ 347
METRIC RANK
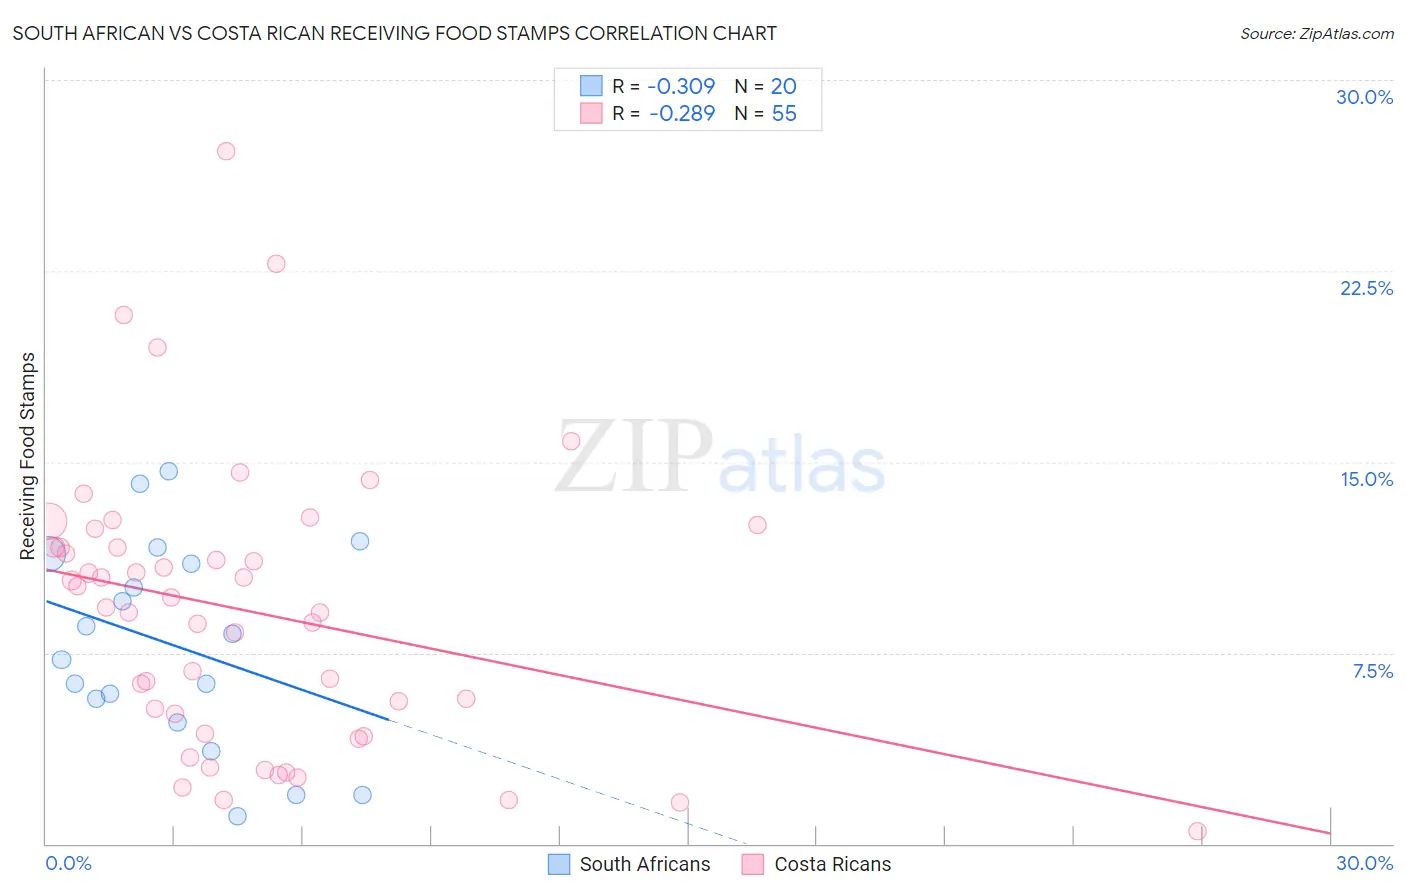
South African vs Costa Rican Receiving Food Stamps Correlation Chart
The statistical analysis conducted on geographies consisting of 182,246,088 people shows a mild negative correlation between the proportion of South Africans and percentage of population receiving government assistance and/or food stamps in the United States with a correlation coefficient (R) of -0.309 and weighted average of 10.0%. Similarly, the statistical analysis conducted on geographies consisting of 253,245,206 people shows a weak negative correlation between the proportion of Costa Ricans and percentage of population receiving government assistance and/or food stamps in the United States with a correlation coefficient (R) of -0.289 and weighted average of 11.6%, a difference of 16.5%.
Receiving Food Stamps Correlation Summary
| Measurement | South African | Costa Rican |
| Minimum | 1.1% | 0.50% |
| Maximum | 14.6% | 27.2% |
| Range | 13.5% | 26.7% |
| Mean | 7.8% | 9.1% |
| Median | 7.8% | 9.3% |
| Interquartile 25% (IQ1) | 5.2% | 4.3% |
| Interquartile 75% (IQ3) | 11.2% | 11.7% |
| Interquartile Range (IQR) | 6.0% | 7.4% |
| Standard Deviation (Sample) | 4.0% | 5.6% |
| Standard Deviation (Population) | 3.9% | 5.5% |
Similar Demographics by Receiving Food Stamps
Demographics Similar to South Africans by Receiving Food Stamps
In terms of receiving food stamps, the demographic groups most similar to South Africans are Laotian (10.0%, a difference of 0.040%), Immigrants from North Macedonia (10.0%, a difference of 0.050%), Polish (10.0%, a difference of 0.12%), Immigrants from Croatia (10.0%, a difference of 0.13%), and Immigrants from Zimbabwe (9.9%, a difference of 0.14%).
| Demographics | Rating | Rank | Receiving Food Stamps |
| Scottish | 98.9 /100 | #71 | Exceptional 9.9% |
| Immigrants | Asia | 98.9 /100 | #72 | Exceptional 9.9% |
| Macedonians | 98.9 /100 | #73 | Exceptional 9.9% |
| New Zealanders | 98.8 /100 | #74 | Exceptional 9.9% |
| Immigrants | Zimbabwe | 98.7 /100 | #75 | Exceptional 9.9% |
| Immigrants | Croatia | 98.7 /100 | #76 | Exceptional 10.0% |
| Immigrants | North Macedonia | 98.7 /100 | #77 | Exceptional 10.0% |
| South Africans | 98.7 /100 | #78 | Exceptional 10.0% |
| Laotians | 98.7 /100 | #79 | Exceptional 10.0% |
| Poles | 98.6 /100 | #80 | Exceptional 10.0% |
| Immigrants | England | 98.6 /100 | #81 | Exceptional 10.0% |
| Austrians | 98.6 /100 | #82 | Exceptional 10.0% |
| Dutch | 98.6 /100 | #83 | Exceptional 10.0% |
| Immigrants | Israel | 98.5 /100 | #84 | Exceptional 10.0% |
| Immigrants | Romania | 98.5 /100 | #85 | Exceptional 10.0% |
Demographics Similar to Costa Ricans by Receiving Food Stamps
In terms of receiving food stamps, the demographic groups most similar to Costa Ricans are Immigrants from Eastern Africa (11.6%, a difference of 0.060%), Tlingit-Haida (11.6%, a difference of 0.18%), Immigrants from Western Asia (11.6%, a difference of 0.22%), Kenyan (11.6%, a difference of 0.35%), and Guamanian/Chamorro (11.7%, a difference of 0.53%).
| Demographics | Rating | Rank | Receiving Food Stamps |
| Immigrants | Southern Europe | 65.8 /100 | #163 | Good 11.5% |
| Immigrants | Chile | 65.0 /100 | #164 | Good 11.5% |
| Arabs | 64.7 /100 | #165 | Good 11.5% |
| Immigrants | Belarus | 62.8 /100 | #166 | Good 11.5% |
| Kenyans | 60.2 /100 | #167 | Good 11.6% |
| Tlingit-Haida | 59.1 /100 | #168 | Average 11.6% |
| Immigrants | Eastern Africa | 58.3 /100 | #169 | Average 11.6% |
| Costa Ricans | 57.9 /100 | #170 | Average 11.6% |
| Immigrants | Western Asia | 56.4 /100 | #171 | Average 11.6% |
| Guamanians/Chamorros | 54.2 /100 | #172 | Average 11.7% |
| Immigrants | Syria | 53.4 /100 | #173 | Average 11.7% |
| Immigrants | Eritrea | 50.0 /100 | #174 | Average 11.7% |
| Osage | 49.8 /100 | #175 | Average 11.7% |
| Peruvians | 49.3 /100 | #176 | Average 11.7% |
| Immigrants | Ukraine | 48.4 /100 | #177 | Average 11.8% |