South African vs Immigrants from Moldova Unemployment Among Ages 55 to 59 years
COMPARE
South African
Immigrants from Moldova
Unemployment Among Ages 55 to 59 years
Unemployment Among Ages 55 to 59 years Comparison
South Africans
Immigrants from Moldova
4.7%
UNEMPLOYMENT AMONG AGES 55 TO 59 YEARS
95.6/ 100
METRIC RATING
95th/ 347
METRIC RANK
4.5%
UNEMPLOYMENT AMONG AGES 55 TO 59 YEARS
99.7/ 100
METRIC RATING
48th/ 347
METRIC RANK
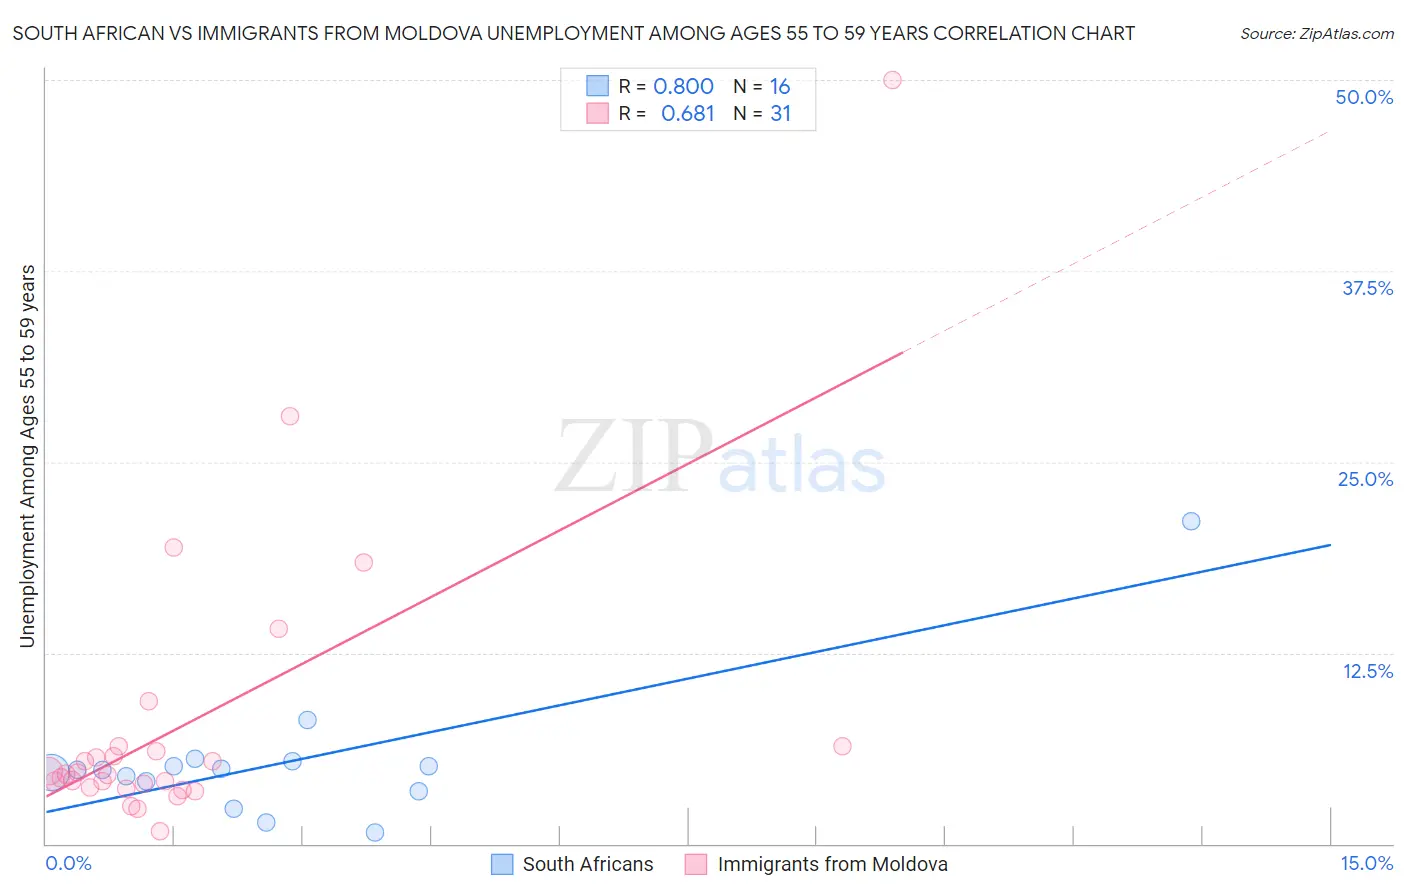
South African vs Immigrants from Moldova Unemployment Among Ages 55 to 59 years Correlation Chart
The statistical analysis conducted on geographies consisting of 175,713,158 people shows a very strong positive correlation between the proportion of South Africans and unemployment rate among population between the ages 55 and 59 in the United States with a correlation coefficient (R) of 0.800 and weighted average of 4.7%. Similarly, the statistical analysis conducted on geographies consisting of 121,585,919 people shows a significant positive correlation between the proportion of Immigrants from Moldova and unemployment rate among population between the ages 55 and 59 in the United States with a correlation coefficient (R) of 0.681 and weighted average of 4.5%, a difference of 3.0%.
Unemployment Among Ages 55 to 59 years Correlation Summary
| Measurement | South African | Immigrants from Moldova |
| Minimum | 0.70% | 0.80% |
| Maximum | 21.1% | 50.0% |
| Range | 20.4% | 49.2% |
| Mean | 5.4% | 7.9% |
| Median | 4.8% | 4.6% |
| Interquartile 25% (IQ1) | 3.7% | 3.7% |
| Interquartile 75% (IQ3) | 5.3% | 6.4% |
| Interquartile Range (IQR) | 1.5% | 2.7% |
| Standard Deviation (Sample) | 4.5% | 9.7% |
| Standard Deviation (Population) | 4.4% | 9.6% |
Similar Demographics by Unemployment Among Ages 55 to 59 years
Demographics Similar to South Africans by Unemployment Among Ages 55 to 59 years
In terms of unemployment among ages 55 to 59 years, the demographic groups most similar to South Africans are Immigrants from Scotland (4.7%, a difference of 0.030%), Immigrants from England (4.7%, a difference of 0.040%), Iraqi (4.7%, a difference of 0.12%), Immigrants from Belgium (4.7%, a difference of 0.16%), and Immigrants from Canada (4.7%, a difference of 0.17%).
| Demographics | Rating | Rank | Unemployment Among Ages 55 to 59 years |
| Immigrants | Cameroon | 96.9 /100 | #88 | Exceptional 4.7% |
| Irish | 96.8 /100 | #89 | Exceptional 4.7% |
| Immigrants | Poland | 96.4 /100 | #90 | Exceptional 4.7% |
| New Zealanders | 96.3 /100 | #91 | Exceptional 4.7% |
| Iraqis | 96.1 /100 | #92 | Exceptional 4.7% |
| Immigrants | England | 95.8 /100 | #93 | Exceptional 4.7% |
| Immigrants | Scotland | 95.7 /100 | #94 | Exceptional 4.7% |
| South Africans | 95.6 /100 | #95 | Exceptional 4.7% |
| Immigrants | Belgium | 95.0 /100 | #96 | Exceptional 4.7% |
| Immigrants | Canada | 94.9 /100 | #97 | Exceptional 4.7% |
| Immigrants | Germany | 94.8 /100 | #98 | Exceptional 4.7% |
| Yugoslavians | 94.7 /100 | #99 | Exceptional 4.7% |
| Serbians | 94.4 /100 | #100 | Exceptional 4.7% |
| Celtics | 94.3 /100 | #101 | Exceptional 4.7% |
| Canadians | 94.1 /100 | #102 | Exceptional 4.7% |
Demographics Similar to Immigrants from Moldova by Unemployment Among Ages 55 to 59 years
In terms of unemployment among ages 55 to 59 years, the demographic groups most similar to Immigrants from Moldova are Immigrants from Saudi Arabia (4.5%, a difference of 0.020%), Immigrants from Pakistan (4.5%, a difference of 0.040%), Maltese (4.5%, a difference of 0.070%), Scottish (4.5%, a difference of 0.18%), and Immigrants from Middle Africa (4.5%, a difference of 0.19%).
| Demographics | Rating | Rank | Unemployment Among Ages 55 to 59 years |
| Luxembourgers | 99.8 /100 | #41 | Exceptional 4.5% |
| Immigrants | Kuwait | 99.8 /100 | #42 | Exceptional 4.5% |
| Immigrants | Korea | 99.8 /100 | #43 | Exceptional 4.5% |
| Europeans | 99.8 /100 | #44 | Exceptional 4.5% |
| British | 99.8 /100 | #45 | Exceptional 4.5% |
| Immigrants | Zaire | 99.8 /100 | #46 | Exceptional 4.5% |
| German Russians | 99.8 /100 | #47 | Exceptional 4.5% |
| Immigrants | Moldova | 99.7 /100 | #48 | Exceptional 4.5% |
| Immigrants | Saudi Arabia | 99.7 /100 | #49 | Exceptional 4.5% |
| Immigrants | Pakistan | 99.7 /100 | #50 | Exceptional 4.5% |
| Maltese | 99.7 /100 | #51 | Exceptional 4.5% |
| Scottish | 99.7 /100 | #52 | Exceptional 4.5% |
| Immigrants | Middle Africa | 99.7 /100 | #53 | Exceptional 4.5% |
| Burmese | 99.7 /100 | #54 | Exceptional 4.5% |
| Immigrants | Nepal | 99.6 /100 | #55 | Exceptional 4.5% |