South African vs Romanian Single Male Poverty
COMPARE
South African
Romanian
Single Male Poverty
Single Male Poverty Comparison
South Africans
Romanians
12.8%
SINGLE MALE POVERTY
51.5/ 100
METRIC RATING
171st/ 347
METRIC RANK
12.5%
SINGLE MALE POVERTY
86.4/ 100
METRIC RATING
126th/ 347
METRIC RANK
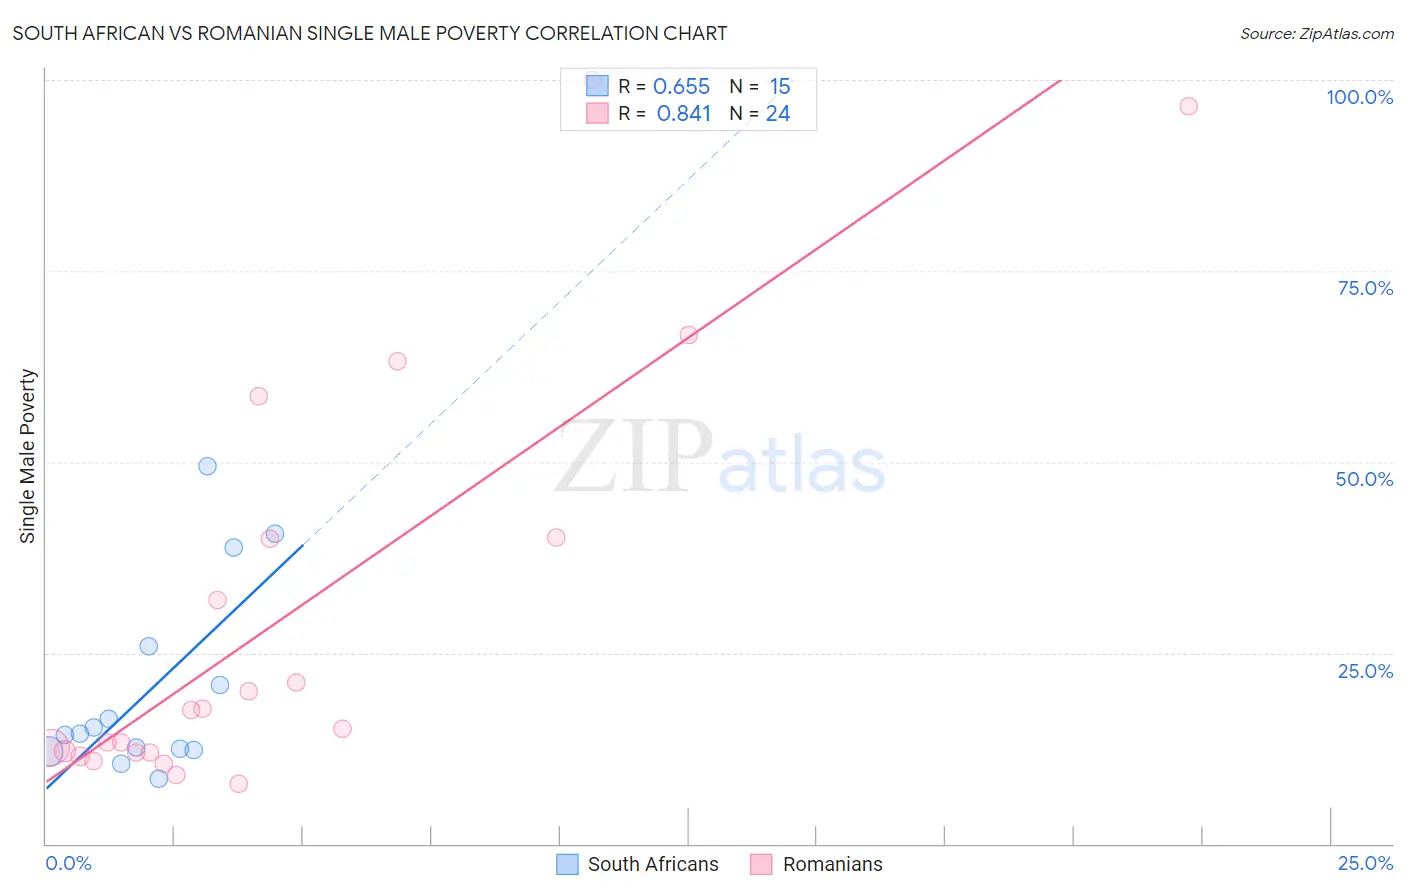
South African vs Romanian Single Male Poverty Correlation Chart
The statistical analysis conducted on geographies consisting of 166,469,004 people shows a significant positive correlation between the proportion of South Africans and poverty level among single males in the United States with a correlation coefficient (R) of 0.655 and weighted average of 12.8%. Similarly, the statistical analysis conducted on geographies consisting of 331,496,845 people shows a very strong positive correlation between the proportion of Romanians and poverty level among single males in the United States with a correlation coefficient (R) of 0.841 and weighted average of 12.5%, a difference of 2.4%.
Single Male Poverty Correlation Summary
| Measurement | South African | Romanian |
| Minimum | 8.5% | 7.9% |
| Maximum | 49.4% | 100.0% |
| Range | 41.0% | 92.1% |
| Mean | 20.3% | 29.7% |
| Median | 14.3% | 16.2% |
| Interquartile 25% (IQ1) | 12.3% | 12.0% |
| Interquartile 75% (IQ3) | 25.9% | 40.1% |
| Interquartile Range (IQR) | 13.6% | 28.1% |
| Standard Deviation (Sample) | 12.6% | 27.5% |
| Standard Deviation (Population) | 12.2% | 26.9% |
Similar Demographics by Single Male Poverty
Demographics Similar to South Africans by Single Male Poverty
In terms of single male poverty, the demographic groups most similar to South Africans are Danish (12.8%, a difference of 0.0%), Guyanese (12.8%, a difference of 0.030%), Immigrants from St. Vincent and the Grenadines (12.8%, a difference of 0.030%), Costa Rican (12.8%, a difference of 0.080%), and Croatian (12.8%, a difference of 0.14%).
| Demographics | Rating | Rank | Single Male Poverty |
| Immigrants | Nigeria | 62.8 /100 | #164 | Good 12.7% |
| Immigrants | Cambodia | 62.2 /100 | #165 | Good 12.7% |
| Immigrants | Guyana | 60.5 /100 | #166 | Good 12.7% |
| Immigrants | Sudan | 58.2 /100 | #167 | Average 12.7% |
| Immigrants | Barbados | 57.7 /100 | #168 | Average 12.7% |
| Puget Sound Salish | 54.3 /100 | #169 | Average 12.8% |
| Guyanese | 52.0 /100 | #170 | Average 12.8% |
| South Africans | 51.5 /100 | #171 | Average 12.8% |
| Danes | 51.4 /100 | #172 | Average 12.8% |
| Immigrants | St. Vincent and the Grenadines | 50.9 /100 | #173 | Average 12.8% |
| Costa Ricans | 50.0 /100 | #174 | Average 12.8% |
| Croatians | 48.9 /100 | #175 | Average 12.8% |
| Syrians | 48.4 /100 | #176 | Average 12.8% |
| Immigrants | Canada | 44.8 /100 | #177 | Average 12.8% |
| Immigrants | Switzerland | 43.1 /100 | #178 | Average 12.8% |
Demographics Similar to Romanians by Single Male Poverty
In terms of single male poverty, the demographic groups most similar to Romanians are Immigrants from Netherlands (12.5%, a difference of 0.010%), Ecuadorian (12.5%, a difference of 0.050%), Immigrants from Jordan (12.5%, a difference of 0.080%), Immigrants from Sierra Leone (12.5%, a difference of 0.090%), and Russian (12.5%, a difference of 0.11%).
| Demographics | Rating | Rank | Single Male Poverty |
| Immigrants | Albania | 90.3 /100 | #119 | Exceptional 12.4% |
| Venezuelans | 89.4 /100 | #120 | Excellent 12.4% |
| Icelanders | 88.2 /100 | #121 | Excellent 12.5% |
| Serbians | 87.9 /100 | #122 | Excellent 12.5% |
| Immigrants | Kenya | 87.6 /100 | #123 | Excellent 12.5% |
| Russians | 87.3 /100 | #124 | Excellent 12.5% |
| Immigrants | Jordan | 87.1 /100 | #125 | Excellent 12.5% |
| Romanians | 86.4 /100 | #126 | Excellent 12.5% |
| Immigrants | Netherlands | 86.2 /100 | #127 | Excellent 12.5% |
| Ecuadorians | 85.9 /100 | #128 | Excellent 12.5% |
| Immigrants | Sierra Leone | 85.5 /100 | #129 | Excellent 12.5% |
| Immigrants | Nicaragua | 84.8 /100 | #130 | Excellent 12.5% |
| Immigrants | Northern Europe | 83.7 /100 | #131 | Excellent 12.5% |
| Salvadorans | 83.7 /100 | #132 | Excellent 12.5% |
| Immigrants | Western Asia | 83.4 /100 | #133 | Excellent 12.5% |