South African vs Cree In Labor Force | Age 35-44
COMPARE
South African
Cree
In Labor Force | Age 35-44
In Labor Force | Age 35-44 Comparison
South Africans
Cree
84.3%
IN LABOR FORCE | AGE 35-44
34.1/ 100
METRIC RATING
188th/ 347
METRIC RANK
82.0%
IN LABOR FORCE | AGE 35-44
0.0/ 100
METRIC RATING
309th/ 347
METRIC RANK
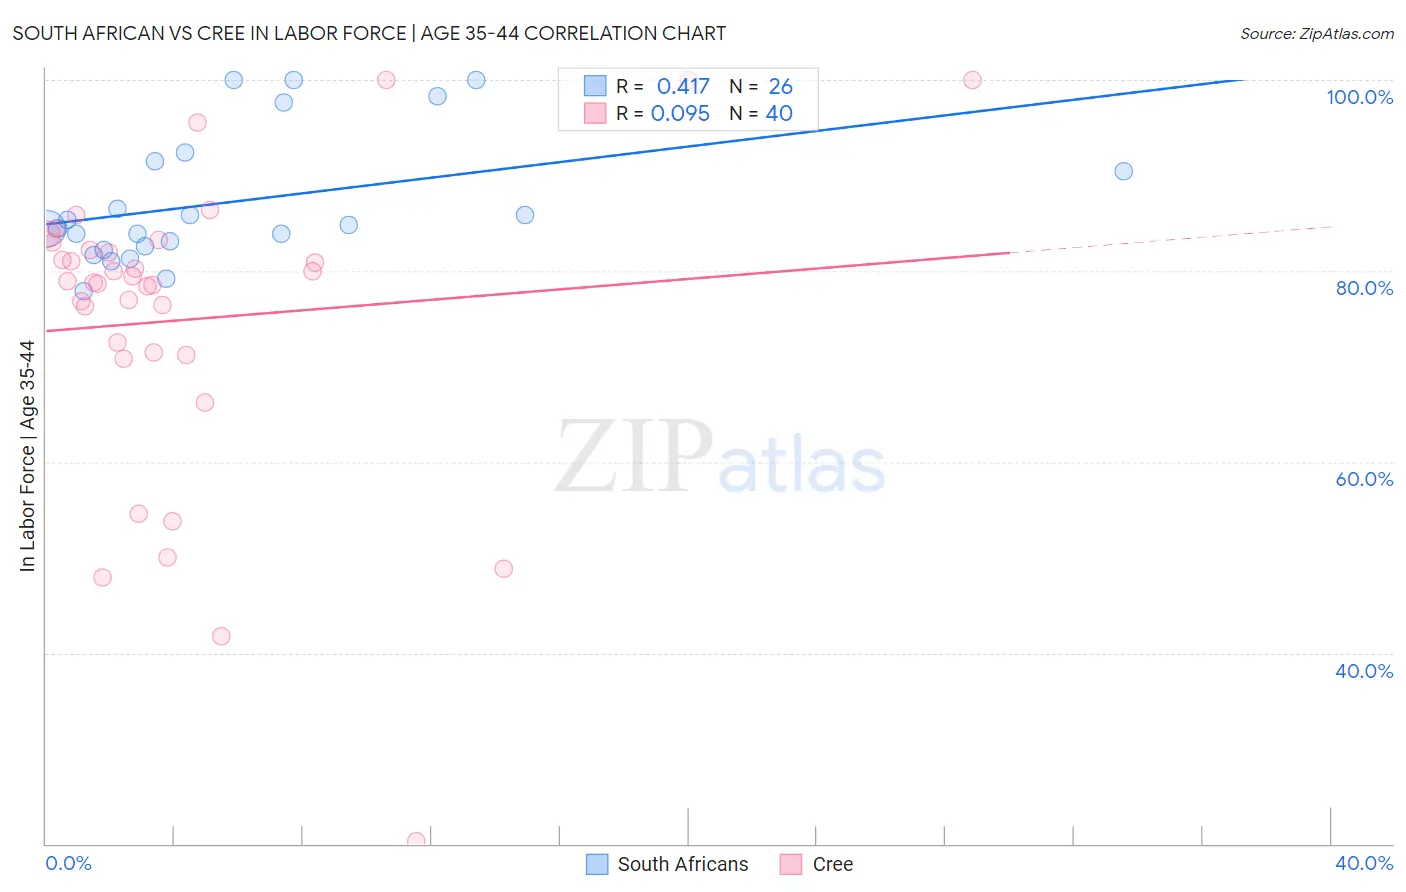
South African vs Cree In Labor Force | Age 35-44 Correlation Chart
The statistical analysis conducted on geographies consisting of 182,546,351 people shows a moderate positive correlation between the proportion of South Africans and labor force participation rate among population between the ages 35 and 44 in the United States with a correlation coefficient (R) of 0.417 and weighted average of 84.3%. Similarly, the statistical analysis conducted on geographies consisting of 76,208,186 people shows a slight positive correlation between the proportion of Cree and labor force participation rate among population between the ages 35 and 44 in the United States with a correlation coefficient (R) of 0.095 and weighted average of 82.0%, a difference of 2.8%.
In Labor Force | Age 35-44 Correlation Summary
| Measurement | South African | Cree |
| Minimum | 77.9% | 20.3% |
| Maximum | 100.0% | 100.0% |
| Range | 22.1% | 79.7% |
| Mean | 87.2% | 74.9% |
| Median | 84.6% | 78.9% |
| Interquartile 25% (IQ1) | 82.6% | 71.3% |
| Interquartile 75% (IQ3) | 91.5% | 82.6% |
| Interquartile Range (IQR) | 8.9% | 11.3% |
| Standard Deviation (Sample) | 6.8% | 16.3% |
| Standard Deviation (Population) | 6.7% | 16.1% |
Similar Demographics by In Labor Force | Age 35-44
Demographics Similar to South Africans by In Labor Force | Age 35-44
In terms of in labor force | age 35-44, the demographic groups most similar to South Africans are Immigrants from Denmark (84.3%, a difference of 0.0%), Armenian (84.3%, a difference of 0.010%), Costa Rican (84.3%, a difference of 0.010%), Australian (84.3%, a difference of 0.010%), and Dutch (84.3%, a difference of 0.010%).
| Demographics | Rating | Rank | In Labor Force | Age 35-44 |
| Immigrants | West Indies | 36.4 /100 | #181 | Fair 84.3% |
| Koreans | 36.3 /100 | #182 | Fair 84.3% |
| Barbadians | 36.2 /100 | #183 | Fair 84.3% |
| Armenians | 35.6 /100 | #184 | Fair 84.3% |
| Costa Ricans | 35.3 /100 | #185 | Fair 84.3% |
| Australians | 35.1 /100 | #186 | Fair 84.3% |
| Dutch | 34.8 /100 | #187 | Fair 84.3% |
| South Africans | 34.1 /100 | #188 | Fair 84.3% |
| Immigrants | Denmark | 33.7 /100 | #189 | Fair 84.3% |
| Portuguese | 31.9 /100 | #190 | Fair 84.3% |
| Immigrants | Philippines | 27.9 /100 | #191 | Fair 84.2% |
| Immigrants | Vietnam | 27.4 /100 | #192 | Fair 84.2% |
| Hungarians | 26.8 /100 | #193 | Fair 84.2% |
| Immigrants | Indonesia | 25.7 /100 | #194 | Fair 84.2% |
| Immigrants | Caribbean | 25.7 /100 | #195 | Fair 84.2% |
Demographics Similar to Cree by In Labor Force | Age 35-44
In terms of in labor force | age 35-44, the demographic groups most similar to Cree are Immigrants from Central America (82.0%, a difference of 0.0%), Blackfeet (81.9%, a difference of 0.12%), Hispanic or Latino (82.1%, a difference of 0.15%), Black/African American (82.2%, a difference of 0.25%), and Shoshone (82.2%, a difference of 0.27%).
| Demographics | Rating | Rank | In Labor Force | Age 35-44 |
| Americans | 0.0 /100 | #302 | Tragic 82.4% |
| Nepalese | 0.0 /100 | #303 | Tragic 82.4% |
| Marshallese | 0.0 /100 | #304 | Tragic 82.4% |
| Shoshone | 0.0 /100 | #305 | Tragic 82.2% |
| Blacks/African Americans | 0.0 /100 | #306 | Tragic 82.2% |
| Hispanics or Latinos | 0.0 /100 | #307 | Tragic 82.1% |
| Immigrants | Central America | 0.0 /100 | #308 | Tragic 82.0% |
| Cree | 0.0 /100 | #309 | Tragic 82.0% |
| Blackfeet | 0.0 /100 | #310 | Tragic 81.9% |
| Colville | 0.0 /100 | #311 | Tragic 81.7% |
| Alaska Natives | 0.0 /100 | #312 | Tragic 81.6% |
| Mexicans | 0.0 /100 | #313 | Tragic 81.6% |
| Cajuns | 0.0 /100 | #314 | Tragic 81.5% |
| Immigrants | Mexico | 0.0 /100 | #315 | Tragic 81.5% |
| Comanche | 0.0 /100 | #316 | Tragic 81.5% |