Immigrants from Eastern Europe vs Welsh Receiving Food Stamps
COMPARE
Immigrants from Eastern Europe
Welsh
Receiving Food Stamps
Receiving Food Stamps Comparison
Immigrants from Eastern Europe
Welsh
10.8%
RECEIVING FOOD STAMPS
89.8/ 100
METRIC RATING
137th/ 347
METRIC RANK
10.3%
RECEIVING FOOD STAMPS
97.3/ 100
METRIC RATING
96th/ 347
METRIC RANK
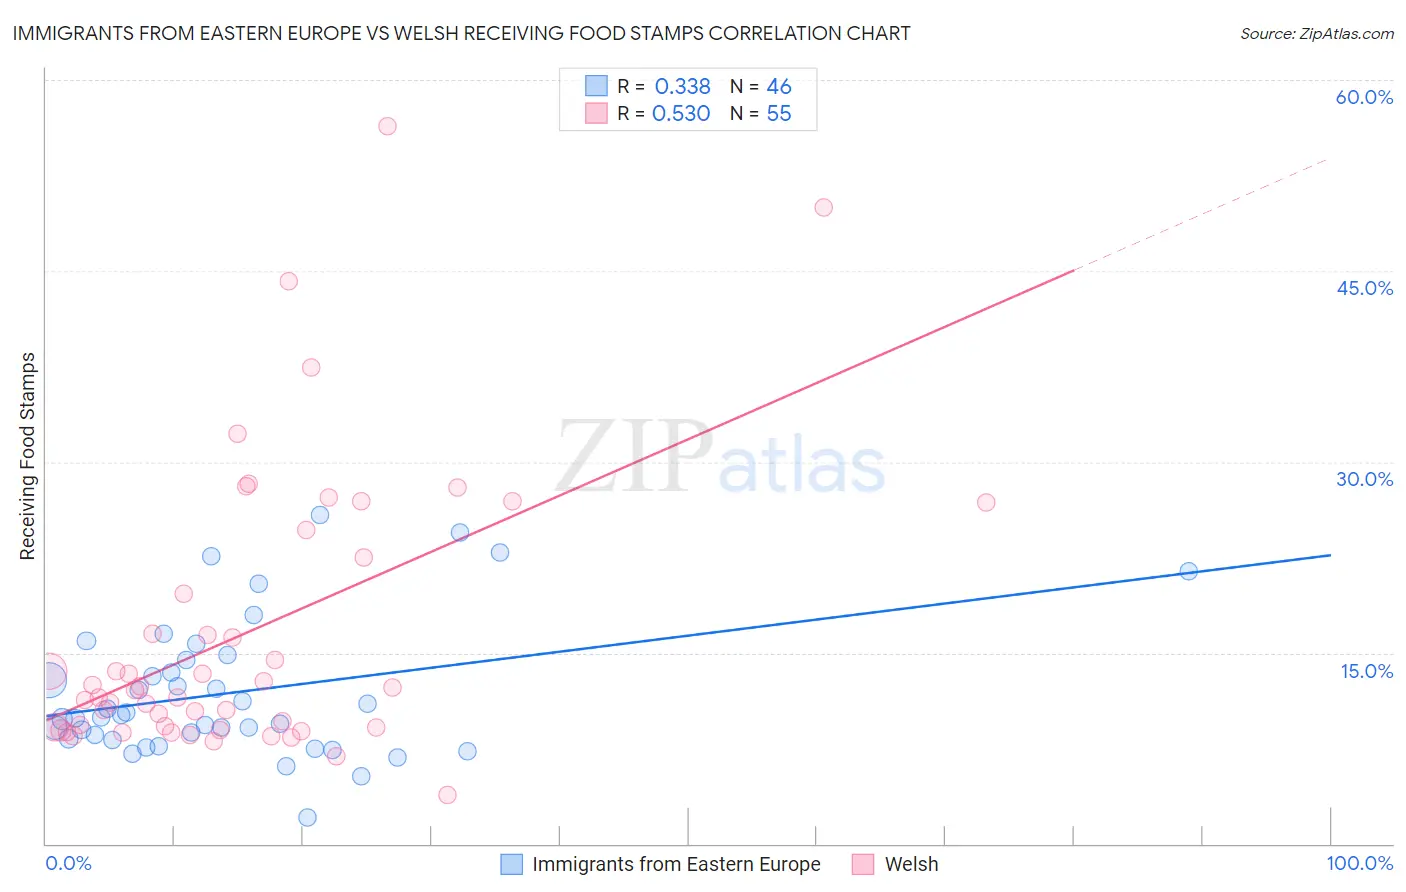
Immigrants from Eastern Europe vs Welsh Receiving Food Stamps Correlation Chart
The statistical analysis conducted on geographies consisting of 473,642,116 people shows a mild positive correlation between the proportion of Immigrants from Eastern Europe and percentage of population receiving government assistance and/or food stamps in the United States with a correlation coefficient (R) of 0.338 and weighted average of 10.8%. Similarly, the statistical analysis conducted on geographies consisting of 526,059,303 people shows a substantial positive correlation between the proportion of Welsh and percentage of population receiving government assistance and/or food stamps in the United States with a correlation coefficient (R) of 0.530 and weighted average of 10.3%, a difference of 5.7%.
Receiving Food Stamps Correlation Summary
| Measurement | Immigrants from Eastern Europe | Welsh |
| Minimum | 2.1% | 3.8% |
| Maximum | 25.8% | 56.4% |
| Range | 23.7% | 52.6% |
| Mean | 11.9% | 16.5% |
| Median | 10.0% | 12.1% |
| Interquartile 25% (IQ1) | 8.3% | 9.1% |
| Interquartile 75% (IQ3) | 14.4% | 22.5% |
| Interquartile Range (IQR) | 6.1% | 13.4% |
| Standard Deviation (Sample) | 5.4% | 11.2% |
| Standard Deviation (Population) | 5.3% | 11.1% |
Similar Demographics by Receiving Food Stamps
Demographics Similar to Immigrants from Eastern Europe by Receiving Food Stamps
In terms of receiving food stamps, the demographic groups most similar to Immigrants from Eastern Europe are Slovak (10.8%, a difference of 0.020%), Argentinean (10.8%, a difference of 0.19%), Immigrants from Brazil (10.8%, a difference of 0.21%), Immigrants from Russia (10.8%, a difference of 0.51%), and Immigrants from Moldova (10.9%, a difference of 0.51%).
| Demographics | Rating | Rank | Receiving Food Stamps |
| Israelis | 92.4 /100 | #130 | Exceptional 10.7% |
| French | 92.3 /100 | #131 | Exceptional 10.7% |
| Immigrants | Germany | 92.0 /100 | #132 | Exceptional 10.7% |
| Immigrants | Russia | 90.9 /100 | #133 | Exceptional 10.8% |
| Immigrants | Brazil | 90.3 /100 | #134 | Exceptional 10.8% |
| Argentineans | 90.2 /100 | #135 | Exceptional 10.8% |
| Slovaks | 89.8 /100 | #136 | Excellent 10.8% |
| Immigrants | Eastern Europe | 89.8 /100 | #137 | Excellent 10.8% |
| Immigrants | Moldova | 88.5 /100 | #138 | Excellent 10.9% |
| Hmong | 88.4 /100 | #139 | Excellent 10.9% |
| Celtics | 87.8 /100 | #140 | Excellent 10.9% |
| Immigrants | Vietnam | 86.7 /100 | #141 | Excellent 11.0% |
| Chileans | 86.2 /100 | #142 | Excellent 11.0% |
| Immigrants | Northern Africa | 86.0 /100 | #143 | Excellent 11.0% |
| Syrians | 85.5 /100 | #144 | Excellent 11.0% |
Demographics Similar to Welsh by Receiving Food Stamps
In terms of receiving food stamps, the demographic groups most similar to Welsh are Basque (10.3%, a difference of 0.050%), Immigrants from Greece (10.3%, a difference of 0.080%), Czechoslovakian (10.3%, a difference of 0.26%), Immigrants from Egypt (10.3%, a difference of 0.31%), and Serbian (10.3%, a difference of 0.49%).
| Demographics | Rating | Rank | Receiving Food Stamps |
| Immigrants | France | 98.3 /100 | #89 | Exceptional 10.1% |
| Finns | 97.9 /100 | #90 | Exceptional 10.2% |
| Jordanians | 97.9 /100 | #91 | Exceptional 10.2% |
| Irish | 97.9 /100 | #92 | Exceptional 10.2% |
| Belgians | 97.7 /100 | #93 | Exceptional 10.2% |
| Immigrants | Greece | 97.4 /100 | #94 | Exceptional 10.3% |
| Basques | 97.4 /100 | #95 | Exceptional 10.3% |
| Welsh | 97.3 /100 | #96 | Exceptional 10.3% |
| Czechoslovakians | 97.2 /100 | #97 | Exceptional 10.3% |
| Immigrants | Egypt | 97.1 /100 | #98 | Exceptional 10.3% |
| Serbians | 97.0 /100 | #99 | Exceptional 10.3% |
| Immigrants | Western Europe | 96.9 /100 | #100 | Exceptional 10.3% |
| Palestinians | 96.9 /100 | #101 | Exceptional 10.3% |
| Immigrants | Europe | 96.8 /100 | #102 | Exceptional 10.3% |
| Immigrants | Latvia | 96.8 /100 | #103 | Exceptional 10.3% |