Honduran vs Ottawa Child Poverty Under the Age of 5
COMPARE
Honduran
Ottawa
Child Poverty Under the Age of 5
Child Poverty Under the Age of 5 Comparison
Hondurans
Ottawa
23.0%
CHILD POVERTY UNDER THE AGE OF 5
0.0/ 100
METRIC RATING
312th/ 347
METRIC RANK
20.3%
CHILD POVERTY UNDER THE AGE OF 5
0.1/ 100
METRIC RATING
267th/ 347
METRIC RANK
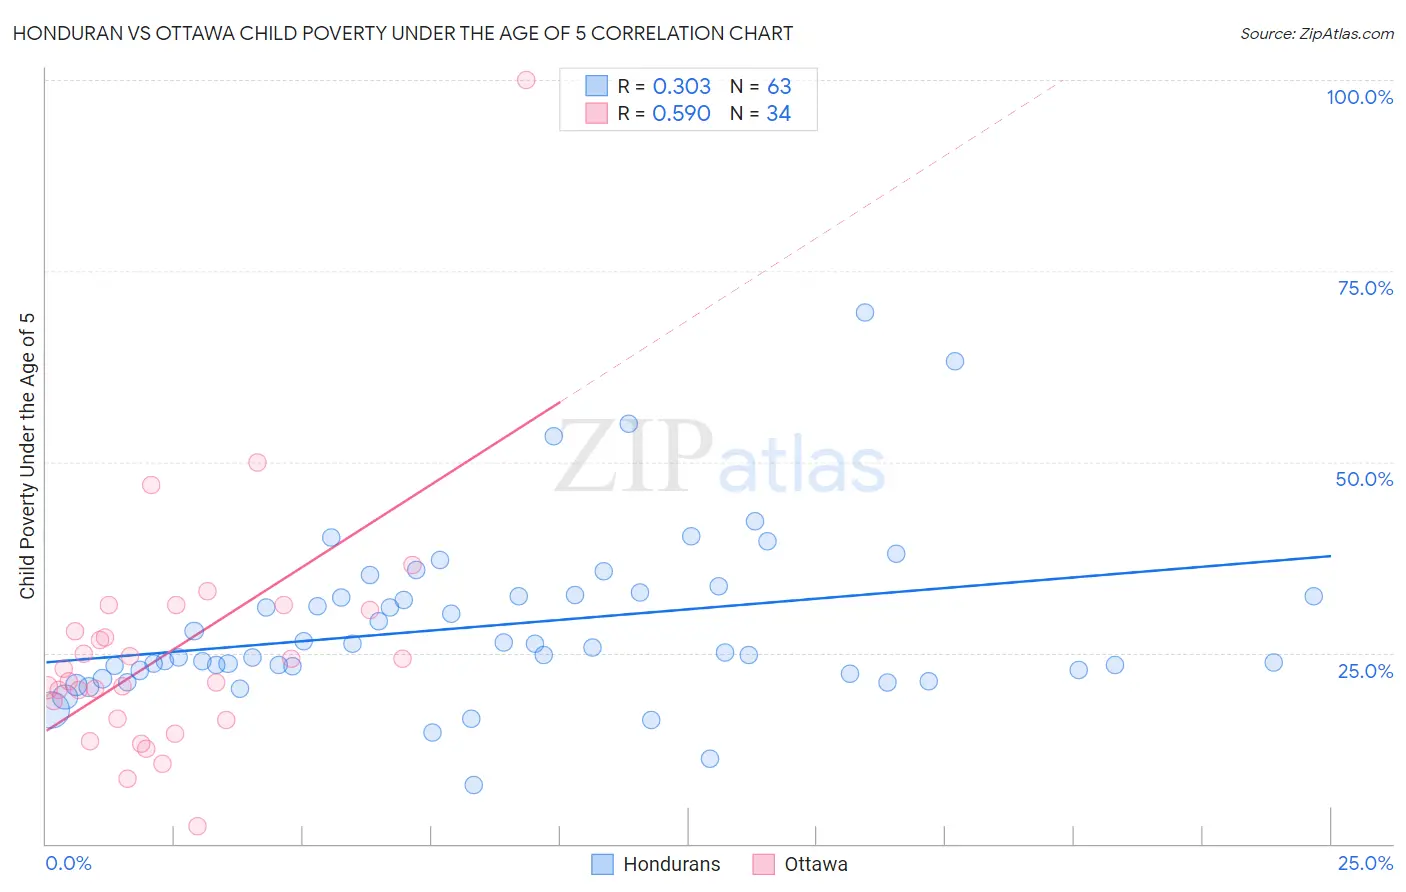
Honduran vs Ottawa Child Poverty Under the Age of 5 Correlation Chart
The statistical analysis conducted on geographies consisting of 349,714,748 people shows a mild positive correlation between the proportion of Hondurans and poverty level among children under the age of 5 in the United States with a correlation coefficient (R) of 0.303 and weighted average of 23.0%. Similarly, the statistical analysis conducted on geographies consisting of 49,352,699 people shows a substantial positive correlation between the proportion of Ottawa and poverty level among children under the age of 5 in the United States with a correlation coefficient (R) of 0.590 and weighted average of 20.3%, a difference of 12.9%.
Child Poverty Under the Age of 5 Correlation Summary
| Measurement | Honduran | Ottawa |
| Minimum | 7.7% | 2.3% |
| Maximum | 69.6% | 100.0% |
| Range | 61.9% | 97.7% |
| Mean | 28.6% | 25.4% |
| Median | 25.0% | 22.1% |
| Interquartile 25% (IQ1) | 22.7% | 16.4% |
| Interquartile 75% (IQ3) | 32.5% | 30.6% |
| Interquartile Range (IQR) | 9.8% | 14.2% |
| Standard Deviation (Sample) | 11.0% | 16.5% |
| Standard Deviation (Population) | 10.9% | 16.2% |
Similar Demographics by Child Poverty Under the Age of 5
Demographics Similar to Hondurans by Child Poverty Under the Age of 5
In terms of child poverty under the age of 5, the demographic groups most similar to Hondurans are Bahamian (23.0%, a difference of 0.050%), U.S. Virgin Islander (23.0%, a difference of 0.14%), Seminole (22.8%, a difference of 0.60%), African (22.8%, a difference of 0.64%), and Arapaho (23.1%, a difference of 0.70%).
| Demographics | Rating | Rank | Child Poverty Under the Age of 5 |
| Immigrants | Mexico | 0.0 /100 | #305 | Tragic 22.2% |
| Indonesians | 0.0 /100 | #306 | Tragic 22.3% |
| Immigrants | Bahamas | 0.0 /100 | #307 | Tragic 22.7% |
| Immigrants | Dominica | 0.0 /100 | #308 | Tragic 22.7% |
| Houma | 0.0 /100 | #309 | Tragic 22.7% |
| Africans | 0.0 /100 | #310 | Tragic 22.8% |
| Seminole | 0.0 /100 | #311 | Tragic 22.8% |
| Hondurans | 0.0 /100 | #312 | Tragic 23.0% |
| Bahamians | 0.0 /100 | #313 | Tragic 23.0% |
| U.S. Virgin Islanders | 0.0 /100 | #314 | Tragic 23.0% |
| Arapaho | 0.0 /100 | #315 | Tragic 23.1% |
| Yakama | 0.0 /100 | #316 | Tragic 23.1% |
| Menominee | 0.0 /100 | #317 | Tragic 23.3% |
| Dutch West Indians | 0.0 /100 | #318 | Tragic 23.3% |
| Chippewa | 0.0 /100 | #319 | Tragic 23.4% |
Demographics Similar to Ottawa by Child Poverty Under the Age of 5
In terms of child poverty under the age of 5, the demographic groups most similar to Ottawa are Belizean (20.3%, a difference of 0.0%), Immigrants from Burma/Myanmar (20.4%, a difference of 0.090%), Jamaican (20.4%, a difference of 0.16%), Aleut (20.3%, a difference of 0.39%), and Spanish American Indian (20.2%, a difference of 0.52%).
| Demographics | Rating | Rank | Child Poverty Under the Age of 5 |
| Spanish Americans | 0.2 /100 | #260 | Tragic 20.1% |
| Immigrants | Bangladesh | 0.2 /100 | #261 | Tragic 20.1% |
| Liberians | 0.1 /100 | #262 | Tragic 20.2% |
| Barbadians | 0.1 /100 | #263 | Tragic 20.2% |
| Immigrants | Liberia | 0.1 /100 | #264 | Tragic 20.2% |
| Spanish American Indians | 0.1 /100 | #265 | Tragic 20.2% |
| Aleuts | 0.1 /100 | #266 | Tragic 20.3% |
| Ottawa | 0.1 /100 | #267 | Tragic 20.3% |
| Belizeans | 0.1 /100 | #268 | Tragic 20.3% |
| Immigrants | Burma/Myanmar | 0.1 /100 | #269 | Tragic 20.4% |
| Jamaicans | 0.1 /100 | #270 | Tragic 20.4% |
| Americans | 0.1 /100 | #271 | Tragic 20.5% |
| Immigrants | Jamaica | 0.1 /100 | #272 | Tragic 20.5% |
| Central Americans | 0.1 /100 | #273 | Tragic 20.6% |
| Immigrants | Belize | 0.1 /100 | #274 | Tragic 20.6% |