Immigrants from Kazakhstan vs Ottawa Child Poverty Under the Age of 5
COMPARE
Immigrants from Kazakhstan
Ottawa
Child Poverty Under the Age of 5
Child Poverty Under the Age of 5 Comparison
Immigrants from Kazakhstan
Ottawa
15.8%
CHILD POVERTY UNDER THE AGE OF 5
96.2/ 100
METRIC RATING
96th/ 347
METRIC RANK
20.3%
CHILD POVERTY UNDER THE AGE OF 5
0.1/ 100
METRIC RATING
267th/ 347
METRIC RANK
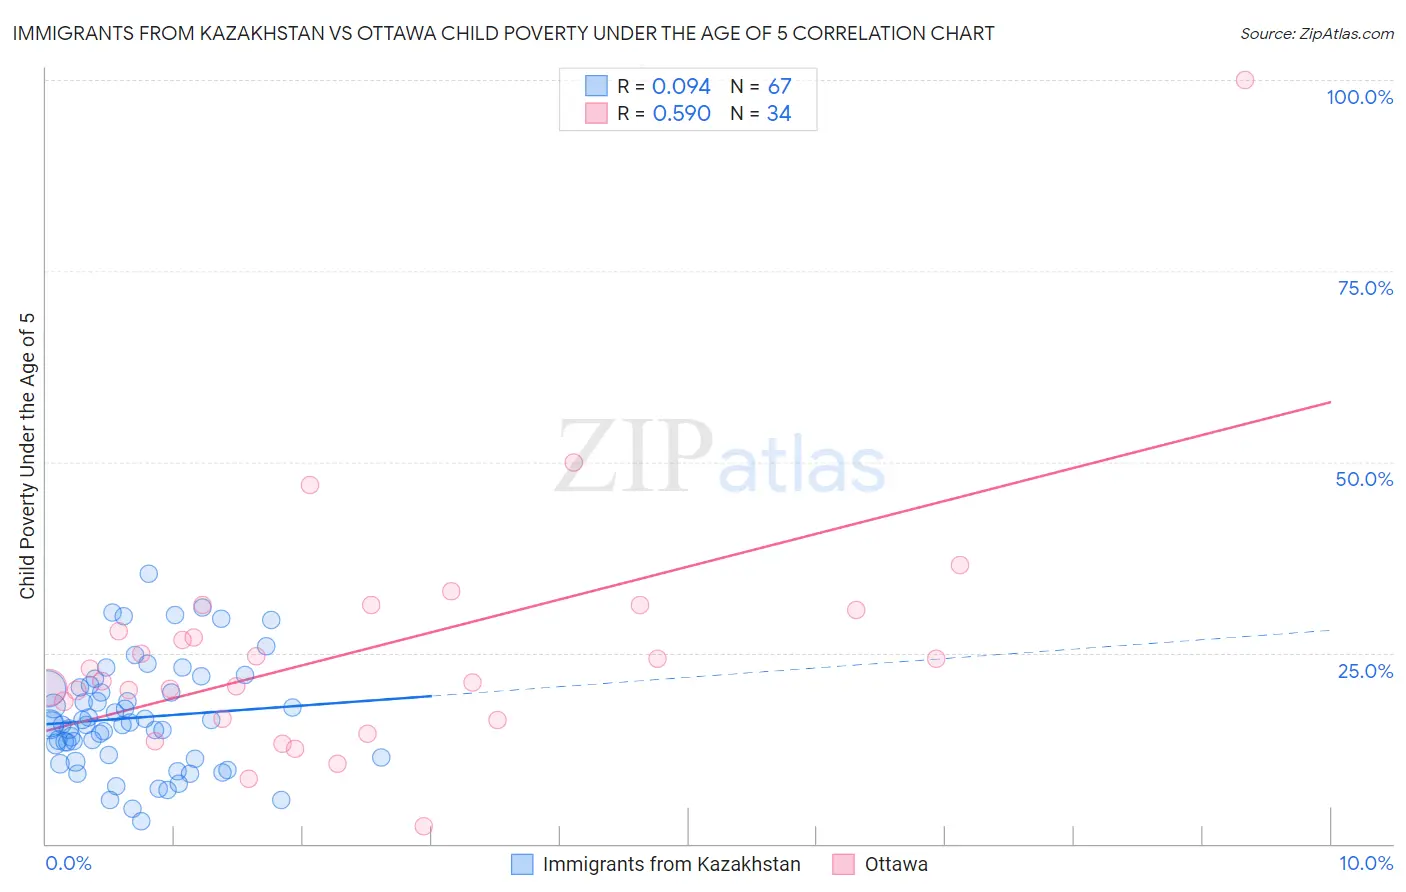
Immigrants from Kazakhstan vs Ottawa Child Poverty Under the Age of 5 Correlation Chart
The statistical analysis conducted on geographies consisting of 121,784,551 people shows a slight positive correlation between the proportion of Immigrants from Kazakhstan and poverty level among children under the age of 5 in the United States with a correlation coefficient (R) of 0.094 and weighted average of 15.8%. Similarly, the statistical analysis conducted on geographies consisting of 49,352,699 people shows a substantial positive correlation between the proportion of Ottawa and poverty level among children under the age of 5 in the United States with a correlation coefficient (R) of 0.590 and weighted average of 20.3%, a difference of 28.8%.
Child Poverty Under the Age of 5 Correlation Summary
| Measurement | Immigrants from Kazakhstan | Ottawa |
| Minimum | 2.9% | 2.3% |
| Maximum | 35.4% | 100.0% |
| Range | 32.4% | 97.7% |
| Mean | 16.5% | 25.4% |
| Median | 15.6% | 22.1% |
| Interquartile 25% (IQ1) | 11.3% | 16.4% |
| Interquartile 75% (IQ3) | 20.5% | 30.6% |
| Interquartile Range (IQR) | 9.2% | 14.2% |
| Standard Deviation (Sample) | 7.1% | 16.5% |
| Standard Deviation (Population) | 7.0% | 16.2% |
Similar Demographics by Child Poverty Under the Age of 5
Demographics Similar to Immigrants from Kazakhstan by Child Poverty Under the Age of 5
In terms of child poverty under the age of 5, the demographic groups most similar to Immigrants from Kazakhstan are Macedonian (15.8%, a difference of 0.040%), Immigrants from South Africa (15.8%, a difference of 0.11%), Immigrants from Switzerland (15.8%, a difference of 0.13%), Palestinian (15.8%, a difference of 0.22%), and Immigrants from Canada (15.8%, a difference of 0.24%).
| Demographics | Rating | Rank | Child Poverty Under the Age of 5 |
| Immigrants | Croatia | 97.3 /100 | #89 | Exceptional 15.6% |
| Immigrants | France | 97.3 /100 | #90 | Exceptional 15.6% |
| Poles | 97.2 /100 | #91 | Exceptional 15.7% |
| Scandinavians | 97.1 /100 | #92 | Exceptional 15.7% |
| Ukrainians | 97.1 /100 | #93 | Exceptional 15.7% |
| Immigrants | South Eastern Asia | 97.1 /100 | #94 | Exceptional 15.7% |
| Immigrants | Switzerland | 96.4 /100 | #95 | Exceptional 15.8% |
| Immigrants | Kazakhstan | 96.2 /100 | #96 | Exceptional 15.8% |
| Macedonians | 96.2 /100 | #97 | Exceptional 15.8% |
| Immigrants | South Africa | 96.1 /100 | #98 | Exceptional 15.8% |
| Palestinians | 95.9 /100 | #99 | Exceptional 15.8% |
| Immigrants | Canada | 95.9 /100 | #100 | Exceptional 15.8% |
| Immigrants | Zimbabwe | 95.9 /100 | #101 | Exceptional 15.8% |
| Armenians | 95.7 /100 | #102 | Exceptional 15.8% |
| Europeans | 95.3 /100 | #103 | Exceptional 15.9% |
Demographics Similar to Ottawa by Child Poverty Under the Age of 5
In terms of child poverty under the age of 5, the demographic groups most similar to Ottawa are Belizean (20.3%, a difference of 0.0%), Immigrants from Burma/Myanmar (20.4%, a difference of 0.090%), Jamaican (20.4%, a difference of 0.16%), Aleut (20.3%, a difference of 0.39%), and Spanish American Indian (20.2%, a difference of 0.52%).
| Demographics | Rating | Rank | Child Poverty Under the Age of 5 |
| Spanish Americans | 0.2 /100 | #260 | Tragic 20.1% |
| Immigrants | Bangladesh | 0.2 /100 | #261 | Tragic 20.1% |
| Liberians | 0.1 /100 | #262 | Tragic 20.2% |
| Barbadians | 0.1 /100 | #263 | Tragic 20.2% |
| Immigrants | Liberia | 0.1 /100 | #264 | Tragic 20.2% |
| Spanish American Indians | 0.1 /100 | #265 | Tragic 20.2% |
| Aleuts | 0.1 /100 | #266 | Tragic 20.3% |
| Ottawa | 0.1 /100 | #267 | Tragic 20.3% |
| Belizeans | 0.1 /100 | #268 | Tragic 20.3% |
| Immigrants | Burma/Myanmar | 0.1 /100 | #269 | Tragic 20.4% |
| Jamaicans | 0.1 /100 | #270 | Tragic 20.4% |
| Americans | 0.1 /100 | #271 | Tragic 20.5% |
| Immigrants | Jamaica | 0.1 /100 | #272 | Tragic 20.5% |
| Central Americans | 0.1 /100 | #273 | Tragic 20.6% |
| Immigrants | Belize | 0.1 /100 | #274 | Tragic 20.6% |