Immigrants from South Eastern Asia vs Immigrants from Indonesia Single Father Poverty
COMPARE
Immigrants from South Eastern Asia
Immigrants from Indonesia
Single Father Poverty
Single Father Poverty Comparison
Immigrants from South Eastern Asia
Immigrants from Indonesia
14.4%
SINGLE FATHER POVERTY
100.0/ 100
METRIC RATING
24th/ 347
METRIC RANK
14.7%
SINGLE FATHER POVERTY
100.0/ 100
METRIC RATING
36th/ 347
METRIC RANK
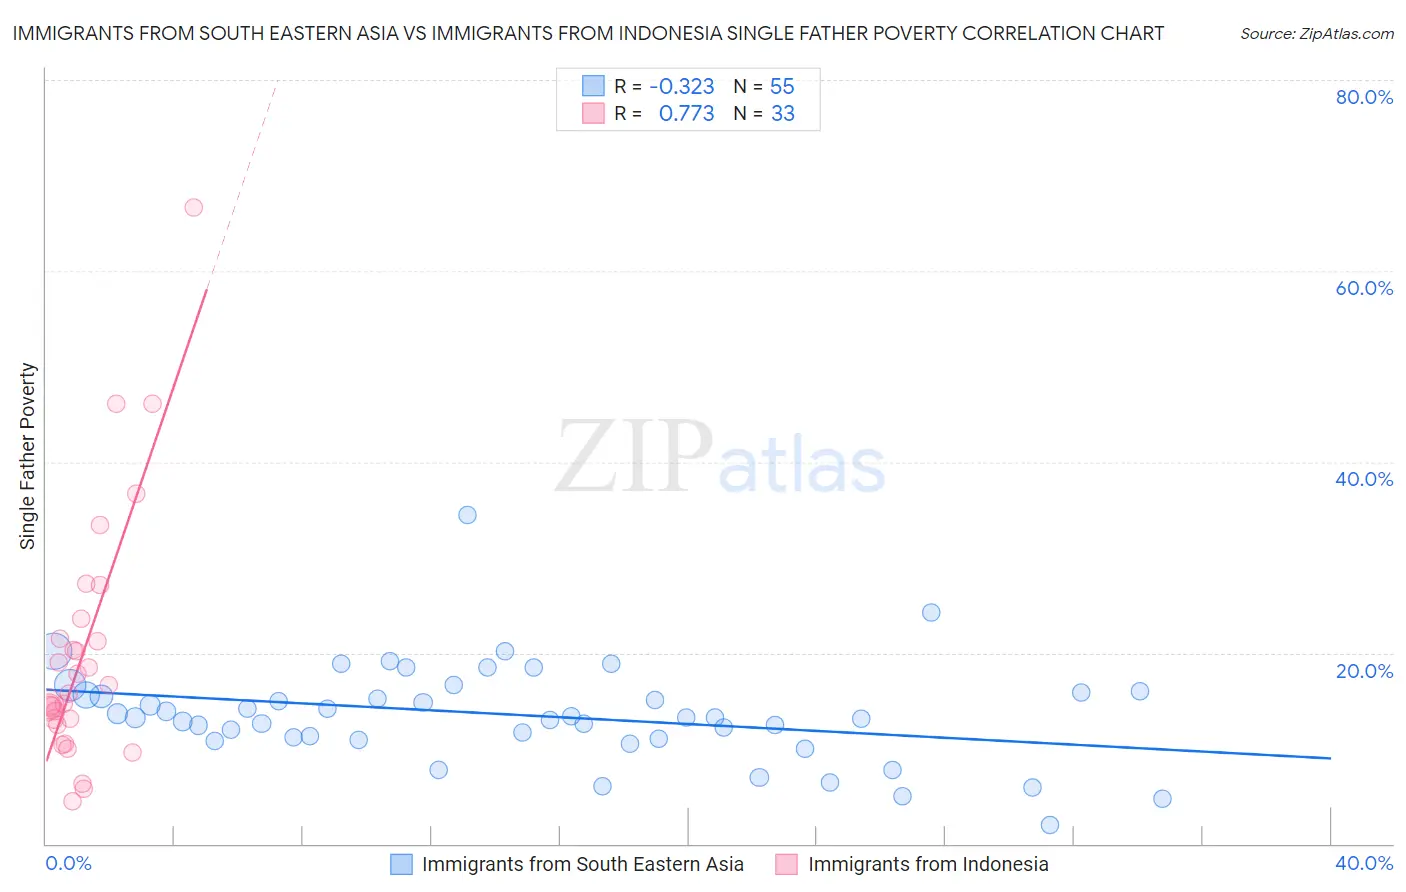
Immigrants from South Eastern Asia vs Immigrants from Indonesia Single Father Poverty Correlation Chart
The statistical analysis conducted on geographies consisting of 383,820,731 people shows a mild negative correlation between the proportion of Immigrants from South Eastern Asia and poverty level among single fathers in the United States with a correlation coefficient (R) of -0.323 and weighted average of 14.4%. Similarly, the statistical analysis conducted on geographies consisting of 182,124,280 people shows a strong positive correlation between the proportion of Immigrants from Indonesia and poverty level among single fathers in the United States with a correlation coefficient (R) of 0.773 and weighted average of 14.7%, a difference of 2.3%.
Single Father Poverty Correlation Summary
| Measurement | Immigrants from South Eastern Asia | Immigrants from Indonesia |
| Minimum | 2.0% | 4.4% |
| Maximum | 34.5% | 66.7% |
| Range | 32.5% | 62.2% |
| Mean | 13.5% | 20.0% |
| Median | 13.2% | 15.7% |
| Interquartile 25% (IQ1) | 11.0% | 12.8% |
| Interquartile 75% (IQ3) | 15.8% | 22.5% |
| Interquartile Range (IQR) | 4.8% | 9.8% |
| Standard Deviation (Sample) | 5.2% | 13.1% |
| Standard Deviation (Population) | 5.2% | 12.9% |
Demographics Similar to Immigrants from South Eastern Asia and Immigrants from Indonesia by Single Father Poverty
In terms of single father poverty, the demographic groups most similar to Immigrants from South Eastern Asia are Immigrants from Egypt (14.4%, a difference of 0.010%), Iranian (14.4%, a difference of 0.030%), Taiwanese (14.3%, a difference of 0.21%), Spanish American Indian (14.4%, a difference of 0.46%), and Nepalese (14.4%, a difference of 0.51%). Similarly, the demographic groups most similar to Immigrants from Indonesia are Immigrants from Eastern Africa (14.7%, a difference of 0.13%), Bolivian (14.7%, a difference of 0.14%), Immigrants from Bolivia (14.7%, a difference of 0.17%), Egyptian (14.7%, a difference of 0.24%), and Immigrants from Asia (14.7%, a difference of 0.31%).
| Demographics | Rating | Rank | Single Father Poverty |
| Immigrants | Singapore | 100.0 /100 | #20 | Exceptional 14.3% |
| Immigrants | Afghanistan | 100.0 /100 | #21 | Exceptional 14.3% |
| Taiwanese | 100.0 /100 | #22 | Exceptional 14.3% |
| Immigrants | Egypt | 100.0 /100 | #23 | Exceptional 14.4% |
| Immigrants | South Eastern Asia | 100.0 /100 | #24 | Exceptional 14.4% |
| Iranians | 100.0 /100 | #25 | Exceptional 14.4% |
| Spanish American Indians | 100.0 /100 | #26 | Exceptional 14.4% |
| Nepalese | 100.0 /100 | #27 | Exceptional 14.4% |
| Immigrants | South Central Asia | 100.0 /100 | #28 | Exceptional 14.5% |
| Somalis | 100.0 /100 | #29 | Exceptional 14.5% |
| Thais | 100.0 /100 | #30 | Exceptional 14.5% |
| Icelanders | 100.0 /100 | #31 | Exceptional 14.5% |
| Asians | 100.0 /100 | #32 | Exceptional 14.6% |
| Okinawans | 100.0 /100 | #33 | Exceptional 14.6% |
| Egyptians | 100.0 /100 | #34 | Exceptional 14.7% |
| Immigrants | Bolivia | 100.0 /100 | #35 | Exceptional 14.7% |
| Immigrants | Indonesia | 100.0 /100 | #36 | Exceptional 14.7% |
| Immigrants | Eastern Africa | 100.0 /100 | #37 | Exceptional 14.7% |
| Bolivians | 100.0 /100 | #38 | Exceptional 14.7% |
| Immigrants | Asia | 100.0 /100 | #39 | Exceptional 14.7% |
| Pima | 100.0 /100 | #40 | Exceptional 14.8% |