Immigrants from Peru vs Chilean Single Father Poverty
COMPARE
Immigrants from Peru
Chilean
Single Father Poverty
Single Father Poverty Comparison
Immigrants from Peru
Chileans
15.3%
SINGLE FATHER POVERTY
99.5/ 100
METRIC RATING
77th/ 347
METRIC RANK
15.7%
SINGLE FATHER POVERTY
96.4/ 100
METRIC RATING
102nd/ 347
METRIC RANK
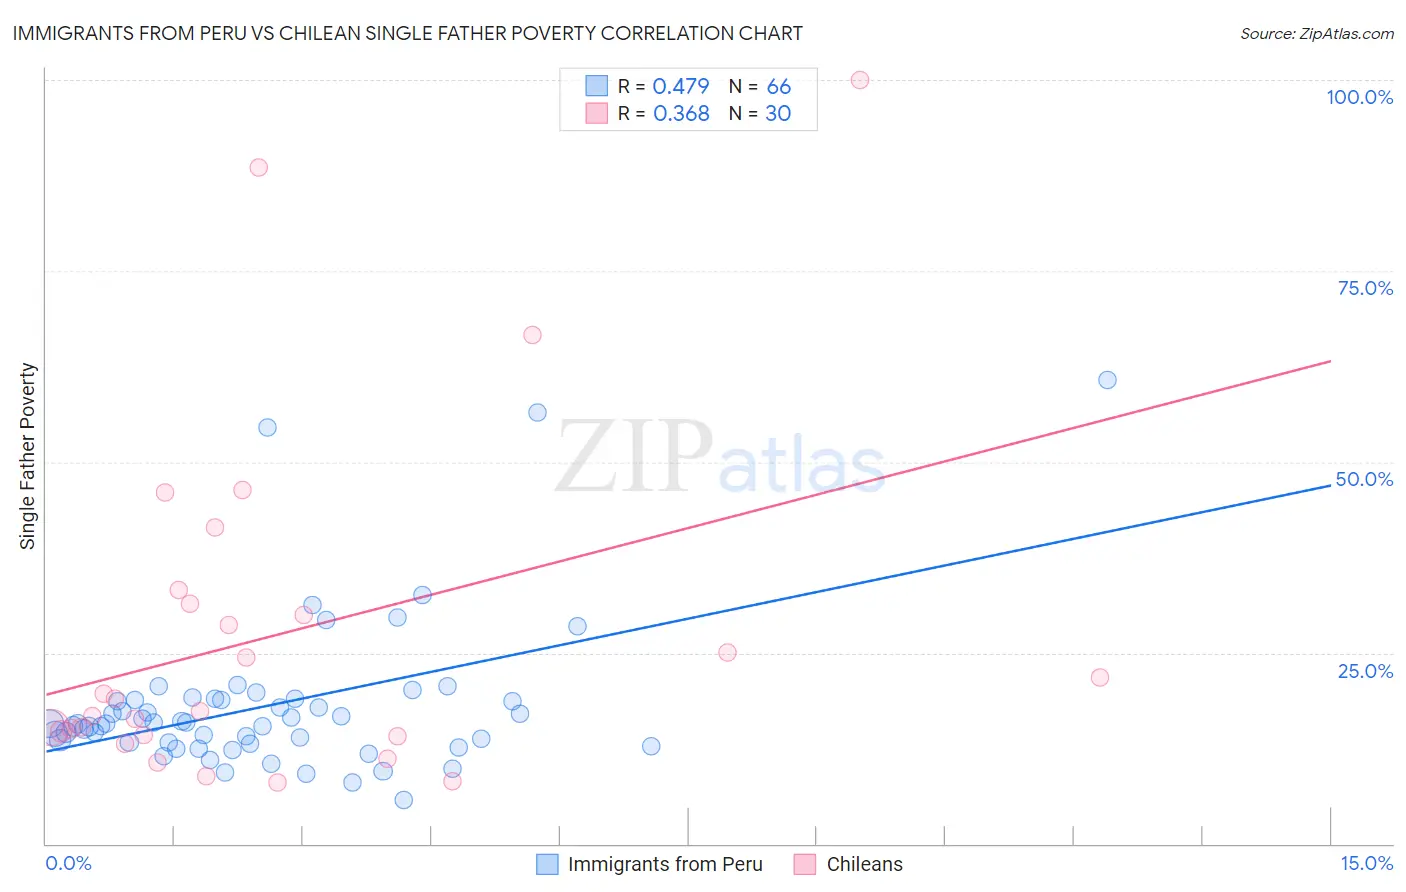
Immigrants from Peru vs Chilean Single Father Poverty Correlation Chart
The statistical analysis conducted on geographies consisting of 267,878,563 people shows a moderate positive correlation between the proportion of Immigrants from Peru and poverty level among single fathers in the United States with a correlation coefficient (R) of 0.479 and weighted average of 15.3%. Similarly, the statistical analysis conducted on geographies consisting of 214,217,238 people shows a mild positive correlation between the proportion of Chileans and poverty level among single fathers in the United States with a correlation coefficient (R) of 0.368 and weighted average of 15.7%, a difference of 2.4%.
Single Father Poverty Correlation Summary
| Measurement | Immigrants from Peru | Chilean |
| Minimum | 5.8% | 8.0% |
| Maximum | 60.7% | 100.0% |
| Range | 55.0% | 92.0% |
| Mean | 18.1% | 27.3% |
| Median | 15.7% | 18.2% |
| Interquartile 25% (IQ1) | 13.2% | 14.2% |
| Interquartile 75% (IQ3) | 18.9% | 31.4% |
| Interquartile Range (IQR) | 5.7% | 17.2% |
| Standard Deviation (Sample) | 10.1% | 22.6% |
| Standard Deviation (Population) | 10.0% | 22.2% |
Similar Demographics by Single Father Poverty
Demographics Similar to Immigrants from Peru by Single Father Poverty
In terms of single father poverty, the demographic groups most similar to Immigrants from Peru are Immigrants from Japan (15.3%, a difference of 0.010%), Tlingit-Haida (15.3%, a difference of 0.050%), Immigrants from Northern Africa (15.3%, a difference of 0.060%), Immigrants from Turkey (15.3%, a difference of 0.090%), and Maltese (15.3%, a difference of 0.11%).
| Demographics | Rating | Rank | Single Father Poverty |
| Mongolians | 99.7 /100 | #70 | Exceptional 15.3% |
| Immigrants | Brazil | 99.6 /100 | #71 | Exceptional 15.3% |
| Immigrants | Lithuania | 99.6 /100 | #72 | Exceptional 15.3% |
| Kenyans | 99.6 /100 | #73 | Exceptional 15.3% |
| Maltese | 99.6 /100 | #74 | Exceptional 15.3% |
| Immigrants | Turkey | 99.5 /100 | #75 | Exceptional 15.3% |
| Immigrants | Japan | 99.5 /100 | #76 | Exceptional 15.3% |
| Immigrants | Peru | 99.5 /100 | #77 | Exceptional 15.3% |
| Tlingit-Haida | 99.5 /100 | #78 | Exceptional 15.3% |
| Immigrants | Northern Africa | 99.5 /100 | #79 | Exceptional 15.3% |
| Armenians | 99.4 /100 | #80 | Exceptional 15.4% |
| Immigrants | Congo | 99.4 /100 | #81 | Exceptional 15.4% |
| Immigrants | Ukraine | 99.4 /100 | #82 | Exceptional 15.4% |
| Chinese | 99.3 /100 | #83 | Exceptional 15.4% |
| Peruvians | 99.2 /100 | #84 | Exceptional 15.4% |
Demographics Similar to Chileans by Single Father Poverty
In terms of single father poverty, the demographic groups most similar to Chileans are South American Indian (15.7%, a difference of 0.060%), Australian (15.7%, a difference of 0.080%), Immigrants from Australia (15.7%, a difference of 0.10%), Fijian (15.7%, a difference of 0.16%), and Immigrants from Poland (15.7%, a difference of 0.17%).
| Demographics | Rating | Rank | Single Father Poverty |
| Immigrants | Kazakhstan | 98.2 /100 | #95 | Exceptional 15.6% |
| Immigrants | Belgium | 98.1 /100 | #96 | Exceptional 15.6% |
| Yaqui | 98.1 /100 | #97 | Exceptional 15.6% |
| Zimbabweans | 98.1 /100 | #98 | Exceptional 15.6% |
| Immigrants | Middle Africa | 97.4 /100 | #99 | Exceptional 15.6% |
| Immigrants | Chile | 96.9 /100 | #100 | Exceptional 15.7% |
| Fijians | 96.8 /100 | #101 | Exceptional 15.7% |
| Chileans | 96.4 /100 | #102 | Exceptional 15.7% |
| South American Indians | 96.2 /100 | #103 | Exceptional 15.7% |
| Australians | 96.1 /100 | #104 | Exceptional 15.7% |
| Immigrants | Australia | 96.1 /100 | #105 | Exceptional 15.7% |
| Immigrants | Poland | 95.8 /100 | #106 | Exceptional 15.7% |
| Native Hawaiians | 95.8 /100 | #107 | Exceptional 15.7% |
| Pakistanis | 95.7 /100 | #108 | Exceptional 15.7% |
| Turks | 95.1 /100 | #109 | Exceptional 15.8% |