Slavic vs Samoan Seniors Poverty Over the Age of 65
COMPARE
Slavic
Samoan
Seniors Poverty Over the Age of 65
Seniors Poverty Over the Age of 65 Comparison
Slavs
Samoans
9.8%
SENIORS POVERTY OVER THE AGE OF 65
99.2/ 100
METRIC RATING
53rd/ 347
METRIC RANK
10.0%
SENIORS POVERTY OVER THE AGE OF 65
98.0/ 100
METRIC RATING
70th/ 347
METRIC RANK
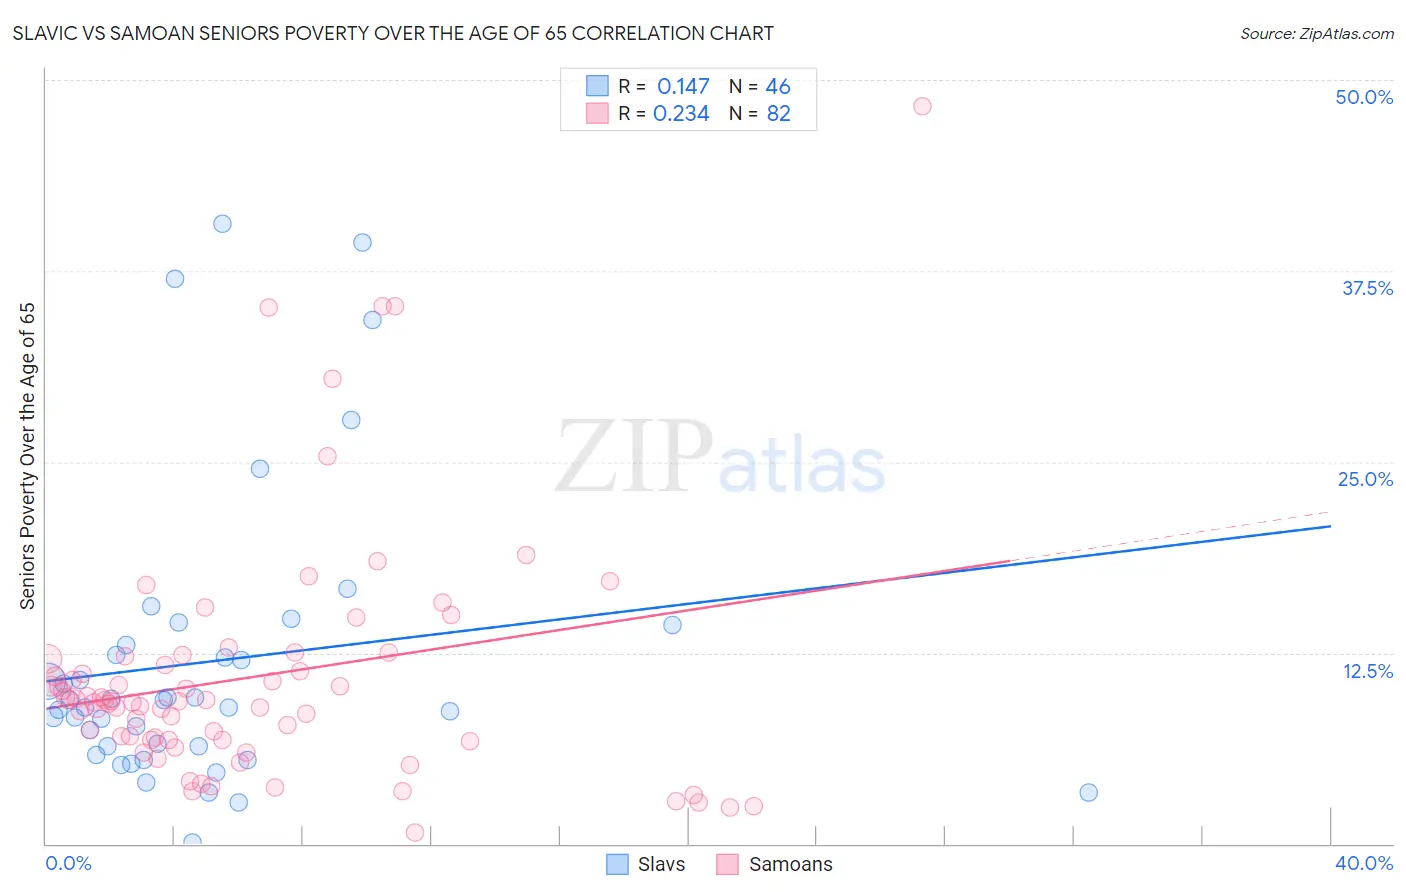
Slavic vs Samoan Seniors Poverty Over the Age of 65 Correlation Chart
The statistical analysis conducted on geographies consisting of 270,346,307 people shows a poor positive correlation between the proportion of Slavs and poverty level among seniors over the age of 65 in the United States with a correlation coefficient (R) of 0.147 and weighted average of 9.8%. Similarly, the statistical analysis conducted on geographies consisting of 224,422,356 people shows a weak positive correlation between the proportion of Samoans and poverty level among seniors over the age of 65 in the United States with a correlation coefficient (R) of 0.234 and weighted average of 10.0%, a difference of 2.4%.
Seniors Poverty Over the Age of 65 Correlation Summary
| Measurement | Slavic | Samoan |
| Minimum | 0.12% | 0.73% |
| Maximum | 40.6% | 48.3% |
| Range | 40.4% | 47.5% |
| Mean | 11.9% | 10.9% |
| Median | 9.2% | 9.4% |
| Interquartile 25% (IQ1) | 6.4% | 6.8% |
| Interquartile 75% (IQ3) | 13.0% | 12.1% |
| Interquartile Range (IQR) | 6.6% | 5.3% |
| Standard Deviation (Sample) | 9.6% | 8.0% |
| Standard Deviation (Population) | 9.5% | 8.0% |
Demographics Similar to Slavs and Samoans by Seniors Poverty Over the Age of 65
In terms of seniors poverty over the age of 65, the demographic groups most similar to Slavs are Immigrants from Northern Europe (9.8%, a difference of 0.060%), Filipino (9.7%, a difference of 0.11%), Carpatho Rusyn (9.7%, a difference of 0.13%), Afghan (9.8%, a difference of 0.19%), and Immigrants from England (9.8%, a difference of 0.31%). Similarly, the demographic groups most similar to Samoans are Yugoslavian (10.0%, a difference of 0.040%), Australian (9.9%, a difference of 0.57%), Canadian (9.9%, a difference of 0.73%), Immigrants from Austria (9.9%, a difference of 0.95%), and Immigrants from Netherlands (9.9%, a difference of 1.1%).
| Demographics | Rating | Rank | Seniors Poverty Over the Age of 65 |
| Carpatho Rusyns | 99.3 /100 | #51 | Exceptional 9.7% |
| Filipinos | 99.3 /100 | #52 | Exceptional 9.7% |
| Slavs | 99.2 /100 | #53 | Exceptional 9.8% |
| Immigrants | Northern Europe | 99.2 /100 | #54 | Exceptional 9.8% |
| Afghans | 99.2 /100 | #55 | Exceptional 9.8% |
| Immigrants | England | 99.1 /100 | #56 | Exceptional 9.8% |
| Bolivians | 99.1 /100 | #57 | Exceptional 9.8% |
| Serbians | 99.1 /100 | #58 | Exceptional 9.8% |
| Immigrants | Canada | 99.0 /100 | #59 | Exceptional 9.8% |
| Celtics | 99.0 /100 | #60 | Exceptional 9.8% |
| Iranians | 98.9 /100 | #61 | Exceptional 9.8% |
| French Canadians | 98.9 /100 | #62 | Exceptional 9.8% |
| Macedonians | 98.8 /100 | #63 | Exceptional 9.9% |
| Immigrants | North America | 98.8 /100 | #64 | Exceptional 9.9% |
| Pennsylvania Germans | 98.7 /100 | #65 | Exceptional 9.9% |
| Immigrants | Netherlands | 98.7 /100 | #66 | Exceptional 9.9% |
| Immigrants | Austria | 98.6 /100 | #67 | Exceptional 9.9% |
| Canadians | 98.5 /100 | #68 | Exceptional 9.9% |
| Australians | 98.4 /100 | #69 | Exceptional 9.9% |
| Samoans | 98.0 /100 | #70 | Exceptional 10.0% |
| Yugoslavians | 97.9 /100 | #71 | Exceptional 10.0% |