Crow vs Samoan Seniors Poverty Over the Age of 65
COMPARE
Crow
Samoan
Seniors Poverty Over the Age of 65
Seniors Poverty Over the Age of 65 Comparison
Crow
Samoans
15.2%
SENIORS POVERTY OVER THE AGE OF 65
0.0/ 100
METRIC RATING
327th/ 347
METRIC RANK
10.0%
SENIORS POVERTY OVER THE AGE OF 65
98.0/ 100
METRIC RATING
70th/ 347
METRIC RANK
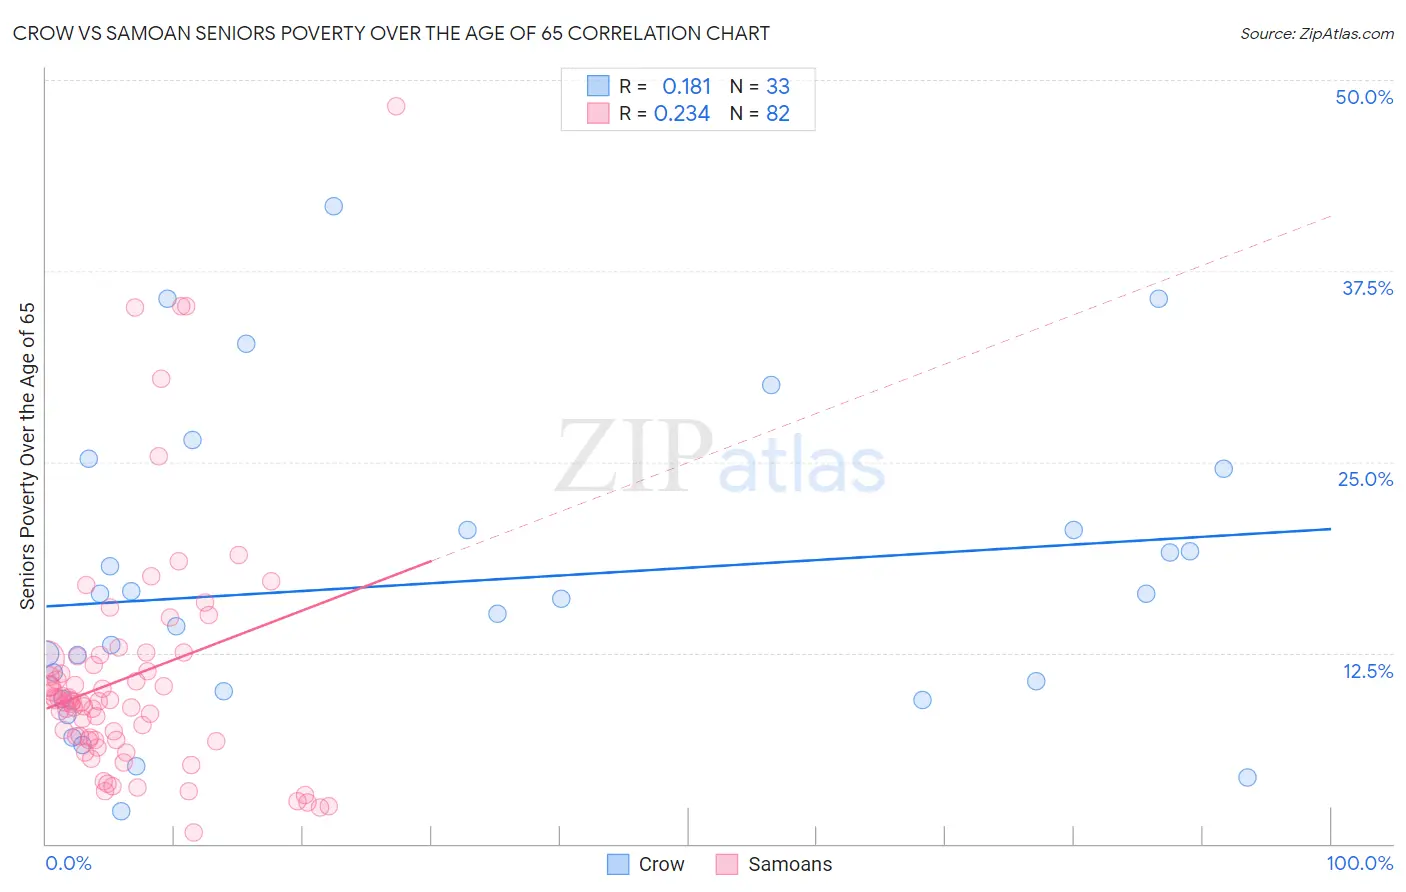
Crow vs Samoan Seniors Poverty Over the Age of 65 Correlation Chart
The statistical analysis conducted on geographies consisting of 59,133,191 people shows a poor positive correlation between the proportion of Crow and poverty level among seniors over the age of 65 in the United States with a correlation coefficient (R) of 0.181 and weighted average of 15.2%. Similarly, the statistical analysis conducted on geographies consisting of 224,422,356 people shows a weak positive correlation between the proportion of Samoans and poverty level among seniors over the age of 65 in the United States with a correlation coefficient (R) of 0.234 and weighted average of 10.0%, a difference of 52.3%.
Seniors Poverty Over the Age of 65 Correlation Summary
| Measurement | Crow | Samoan |
| Minimum | 2.1% | 0.73% |
| Maximum | 41.7% | 48.3% |
| Range | 39.6% | 47.5% |
| Mean | 17.2% | 10.9% |
| Median | 16.1% | 9.4% |
| Interquartile 25% (IQ1) | 9.8% | 6.8% |
| Interquartile 75% (IQ3) | 22.6% | 12.1% |
| Interquartile Range (IQR) | 12.8% | 5.3% |
| Standard Deviation (Sample) | 9.8% | 8.0% |
| Standard Deviation (Population) | 9.7% | 8.0% |
Similar Demographics by Seniors Poverty Over the Age of 65
Demographics Similar to Crow by Seniors Poverty Over the Age of 65
In terms of seniors poverty over the age of 65, the demographic groups most similar to Crow are Immigrants from Armenia (15.2%, a difference of 0.25%), Sioux (15.3%, a difference of 0.54%), Central American Indian (15.1%, a difference of 0.86%), Nicaraguan (15.0%, a difference of 1.5%), and Immigrants from Dominica (15.5%, a difference of 1.6%).
| Demographics | Rating | Rank | Seniors Poverty Over the Age of 65 |
| Immigrants | Haiti | 0.0 /100 | #320 | Tragic 14.7% |
| Houma | 0.0 /100 | #321 | Tragic 14.7% |
| Immigrants | Barbados | 0.0 /100 | #322 | Tragic 14.8% |
| Yakama | 0.0 /100 | #323 | Tragic 14.8% |
| Nicaraguans | 0.0 /100 | #324 | Tragic 15.0% |
| Central American Indians | 0.0 /100 | #325 | Tragic 15.1% |
| Immigrants | Armenia | 0.0 /100 | #326 | Tragic 15.2% |
| Crow | 0.0 /100 | #327 | Tragic 15.2% |
| Sioux | 0.0 /100 | #328 | Tragic 15.3% |
| Immigrants | Dominica | 0.0 /100 | #329 | Tragic 15.5% |
| Immigrants | St. Vincent and the Grenadines | 0.0 /100 | #330 | Tragic 15.5% |
| British West Indians | 0.0 /100 | #331 | Tragic 15.6% |
| Immigrants | Grenada | 0.0 /100 | #332 | Tragic 15.8% |
| Immigrants | Yemen | 0.0 /100 | #333 | Tragic 15.9% |
| Immigrants | Nicaragua | 0.0 /100 | #334 | Tragic 15.9% |
Demographics Similar to Samoans by Seniors Poverty Over the Age of 65
In terms of seniors poverty over the age of 65, the demographic groups most similar to Samoans are Yugoslavian (10.0%, a difference of 0.040%), Palestinian (10.0%, a difference of 0.060%), Russian (10.0%, a difference of 0.090%), Turkish (10.0%, a difference of 0.11%), and Immigrants from Czechoslovakia (10.0%, a difference of 0.20%).
| Demographics | Rating | Rank | Seniors Poverty Over the Age of 65 |
| Macedonians | 98.8 /100 | #63 | Exceptional 9.9% |
| Immigrants | North America | 98.8 /100 | #64 | Exceptional 9.9% |
| Pennsylvania Germans | 98.7 /100 | #65 | Exceptional 9.9% |
| Immigrants | Netherlands | 98.7 /100 | #66 | Exceptional 9.9% |
| Immigrants | Austria | 98.6 /100 | #67 | Exceptional 9.9% |
| Canadians | 98.5 /100 | #68 | Exceptional 9.9% |
| Australians | 98.4 /100 | #69 | Exceptional 9.9% |
| Samoans | 98.0 /100 | #70 | Exceptional 10.0% |
| Yugoslavians | 97.9 /100 | #71 | Exceptional 10.0% |
| Palestinians | 97.9 /100 | #72 | Exceptional 10.0% |
| Russians | 97.9 /100 | #73 | Exceptional 10.0% |
| Turks | 97.9 /100 | #74 | Exceptional 10.0% |
| Immigrants | Czechoslovakia | 97.8 /100 | #75 | Exceptional 10.0% |
| New Zealanders | 97.7 /100 | #76 | Exceptional 10.0% |
| Immigrants | South Africa | 97.7 /100 | #77 | Exceptional 10.0% |