Slavic vs Delaware Unemployment Among Ages 55 to 59 years
COMPARE
Slavic
Delaware
Unemployment Among Ages 55 to 59 years
Unemployment Among Ages 55 to 59 years Comparison
Slavs
Delaware
4.7%
UNEMPLOYMENT AMONG AGES 55 TO 59 YEARS
83.7/ 100
METRIC RATING
135th/ 347
METRIC RANK
4.7%
UNEMPLOYMENT AMONG AGES 55 TO 59 YEARS
83.6/ 100
METRIC RATING
137th/ 347
METRIC RANK
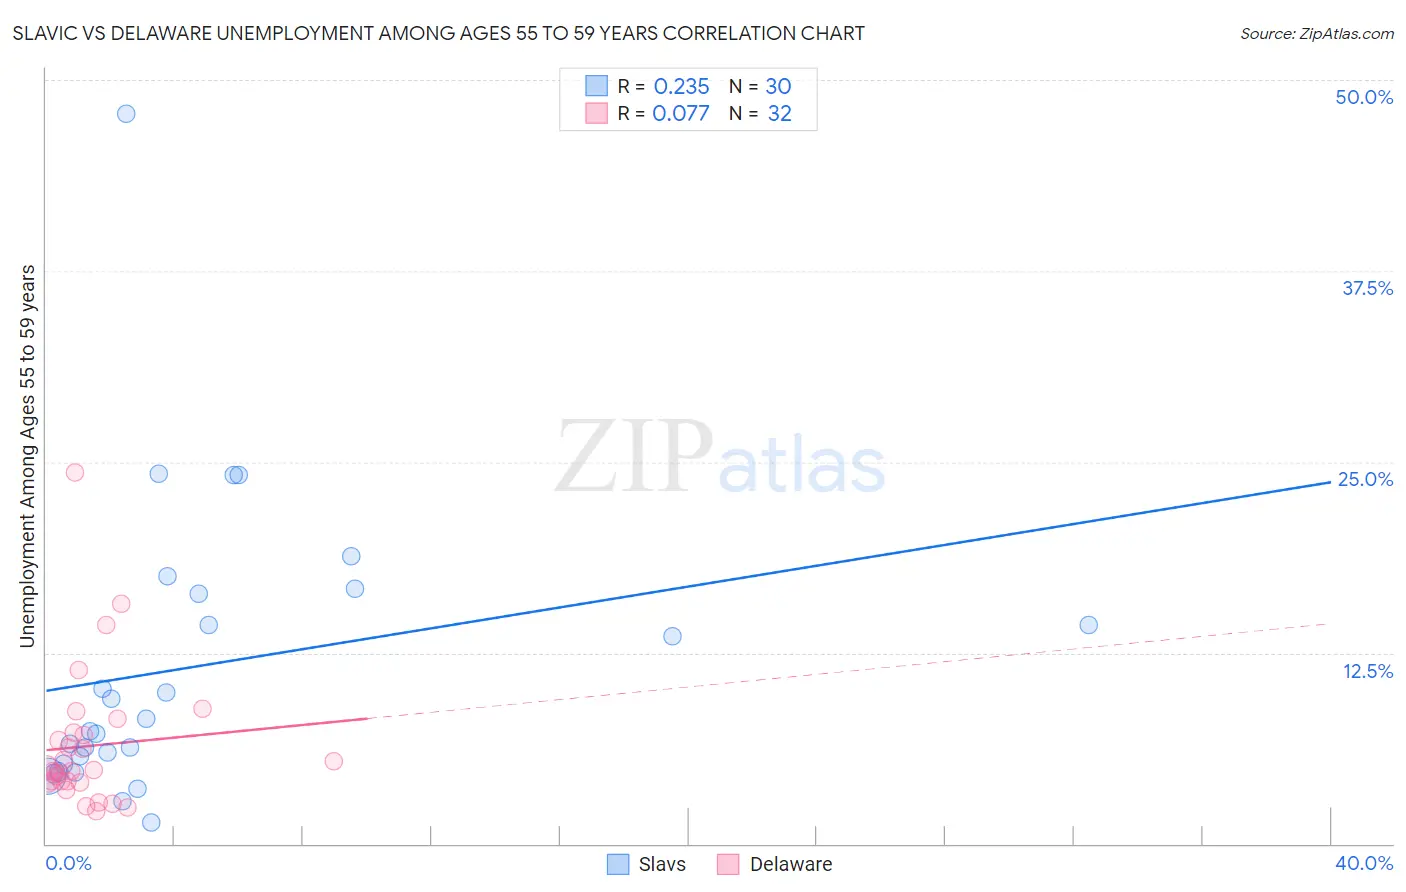
Slavic vs Delaware Unemployment Among Ages 55 to 59 years Correlation Chart
The statistical analysis conducted on geographies consisting of 256,539,964 people shows a weak positive correlation between the proportion of Slavs and unemployment rate among population between the ages 55 and 59 in the United States with a correlation coefficient (R) of 0.235 and weighted average of 4.7%. Similarly, the statistical analysis conducted on geographies consisting of 93,020,993 people shows a slight positive correlation between the proportion of Delaware and unemployment rate among population between the ages 55 and 59 in the United States with a correlation coefficient (R) of 0.077 and weighted average of 4.7%, a difference of 0.010%.
Unemployment Among Ages 55 to 59 years Correlation Summary
| Measurement | Slavic | Delaware |
| Minimum | 1.4% | 2.1% |
| Maximum | 47.8% | 24.3% |
| Range | 46.4% | 22.2% |
| Mean | 11.5% | 6.4% |
| Median | 7.8% | 4.8% |
| Interquartile 25% (IQ1) | 5.2% | 4.0% |
| Interquartile 75% (IQ3) | 16.4% | 7.2% |
| Interquartile Range (IQR) | 11.2% | 3.2% |
| Standard Deviation (Sample) | 9.5% | 4.6% |
| Standard Deviation (Population) | 9.4% | 4.5% |
Demographics Similar to Slavs and Delaware by Unemployment Among Ages 55 to 59 years
In terms of unemployment among ages 55 to 59 years, the demographic groups most similar to Slavs are Colombian (4.7%, a difference of 0.010%), Panamanian (4.7%, a difference of 0.030%), Immigrants from Netherlands (4.7%, a difference of 0.060%), Immigrants from Switzerland (4.7%, a difference of 0.060%), and Romanian (4.7%, a difference of 0.070%). Similarly, the demographic groups most similar to Delaware are Colombian (4.7%, a difference of 0.0%), Panamanian (4.7%, a difference of 0.040%), Immigrants from Switzerland (4.7%, a difference of 0.050%), Romanian (4.7%, a difference of 0.060%), and Immigrants from Netherlands (4.7%, a difference of 0.070%).
| Demographics | Rating | Rank | Unemployment Among Ages 55 to 59 years |
| Immigrants | Serbia | 87.8 /100 | #126 | Excellent 4.7% |
| Icelanders | 87.7 /100 | #127 | Excellent 4.7% |
| Pennsylvania Germans | 87.1 /100 | #128 | Excellent 4.7% |
| Immigrants | Sweden | 86.8 /100 | #129 | Excellent 4.7% |
| Greeks | 86.6 /100 | #130 | Excellent 4.7% |
| Immigrants | Thailand | 85.4 /100 | #131 | Excellent 4.7% |
| Immigrants | Romania | 85.3 /100 | #132 | Excellent 4.7% |
| Immigrants | Netherlands | 84.5 /100 | #133 | Excellent 4.7% |
| Panamanians | 84.1 /100 | #134 | Excellent 4.7% |
| Slavs | 83.7 /100 | #135 | Excellent 4.7% |
| Colombians | 83.6 /100 | #136 | Excellent 4.7% |
| Delaware | 83.6 /100 | #137 | Excellent 4.7% |
| Immigrants | Switzerland | 82.9 /100 | #138 | Excellent 4.7% |
| Romanians | 82.7 /100 | #139 | Excellent 4.7% |
| Immigrants | Indonesia | 80.2 /100 | #140 | Excellent 4.8% |
| French Canadians | 80.1 /100 | #141 | Excellent 4.8% |
| Immigrants | Norway | 79.8 /100 | #142 | Good 4.8% |
| Ukrainians | 78.6 /100 | #143 | Good 4.8% |
| Immigrants | Asia | 77.8 /100 | #144 | Good 4.8% |
| Immigrants | Northern Europe | 77.5 /100 | #145 | Good 4.8% |
| Immigrants | South Eastern Asia | 77.4 /100 | #146 | Good 4.8% |