Sioux vs Hawaiian Seniors Poverty Over the Age of 65
COMPARE
Sioux
Hawaiian
Seniors Poverty Over the Age of 65
Seniors Poverty Over the Age of 65 Comparison
Sioux
Hawaiians
15.3%
SENIORS POVERTY OVER THE AGE OF 65
0.0/ 100
METRIC RATING
328th/ 347
METRIC RANK
10.3%
SENIORS POVERTY OVER THE AGE OF 65
93.9/ 100
METRIC RATING
107th/ 347
METRIC RANK
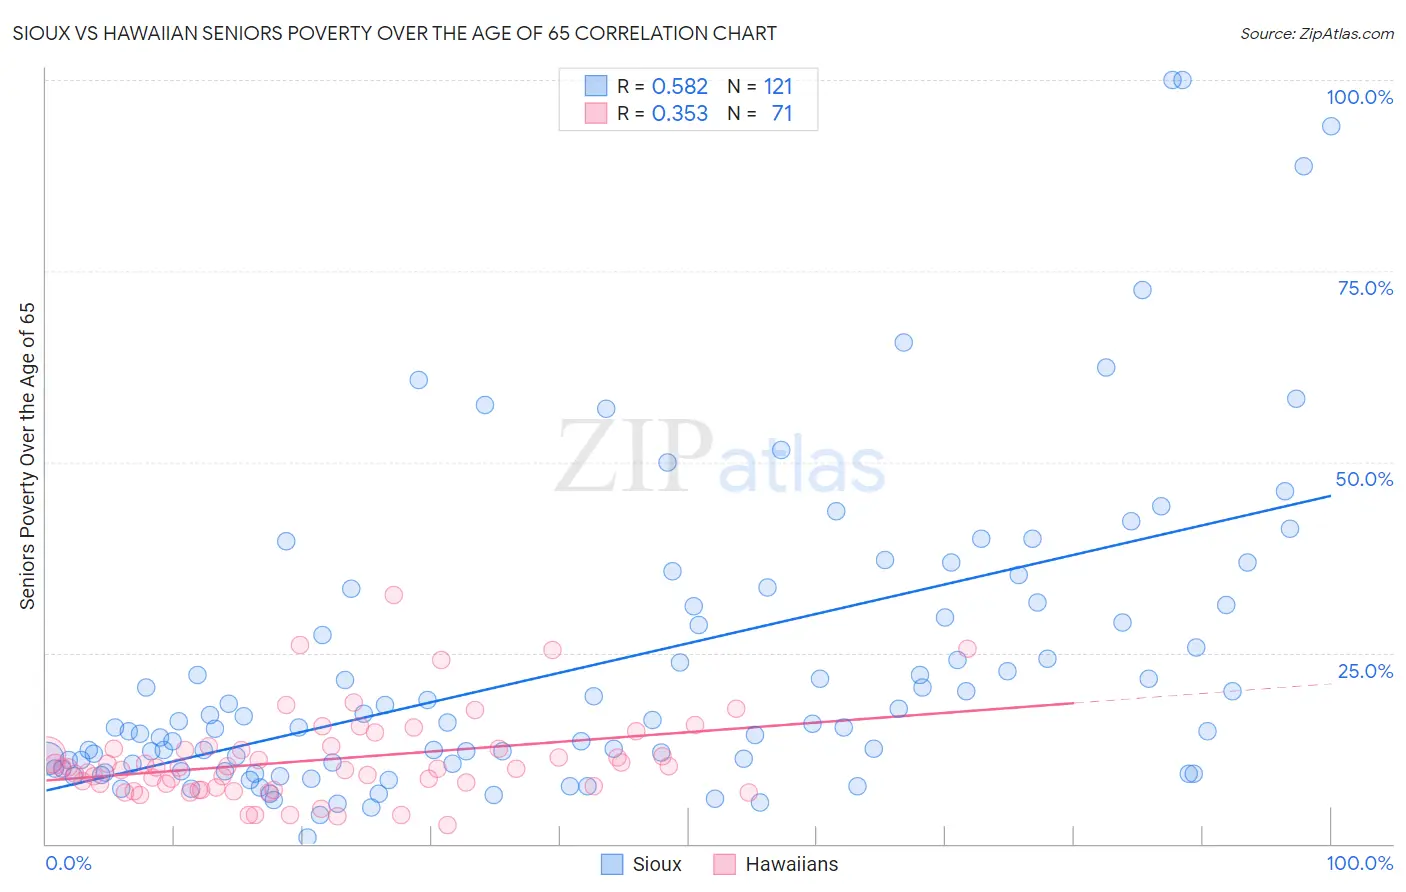
Sioux vs Hawaiian Seniors Poverty Over the Age of 65 Correlation Chart
The statistical analysis conducted on geographies consisting of 233,565,707 people shows a substantial positive correlation between the proportion of Sioux and poverty level among seniors over the age of 65 in the United States with a correlation coefficient (R) of 0.582 and weighted average of 15.3%. Similarly, the statistical analysis conducted on geographies consisting of 326,190,217 people shows a mild positive correlation between the proportion of Hawaiians and poverty level among seniors over the age of 65 in the United States with a correlation coefficient (R) of 0.353 and weighted average of 10.3%, a difference of 49.0%.
Seniors Poverty Over the Age of 65 Correlation Summary
| Measurement | Sioux | Hawaiian |
| Minimum | 0.89% | 2.5% |
| Maximum | 100.0% | 32.5% |
| Range | 99.1% | 30.1% |
| Mean | 23.4% | 11.0% |
| Median | 15.7% | 9.9% |
| Interquartile 25% (IQ1) | 10.2% | 7.4% |
| Interquartile 75% (IQ3) | 31.2% | 12.4% |
| Interquartile Range (IQR) | 21.0% | 5.0% |
| Standard Deviation (Sample) | 20.2% | 5.7% |
| Standard Deviation (Population) | 20.1% | 5.6% |
Similar Demographics by Seniors Poverty Over the Age of 65
Demographics Similar to Sioux by Seniors Poverty Over the Age of 65
In terms of seniors poverty over the age of 65, the demographic groups most similar to Sioux are Crow (15.2%, a difference of 0.54%), Immigrants from Armenia (15.2%, a difference of 0.79%), Immigrants from Dominica (15.5%, a difference of 1.1%), Immigrants from St. Vincent and the Grenadines (15.5%, a difference of 1.4%), and Central American Indian (15.1%, a difference of 1.4%).
| Demographics | Rating | Rank | Seniors Poverty Over the Age of 65 |
| Houma | 0.0 /100 | #321 | Tragic 14.7% |
| Immigrants | Barbados | 0.0 /100 | #322 | Tragic 14.8% |
| Yakama | 0.0 /100 | #323 | Tragic 14.8% |
| Nicaraguans | 0.0 /100 | #324 | Tragic 15.0% |
| Central American Indians | 0.0 /100 | #325 | Tragic 15.1% |
| Immigrants | Armenia | 0.0 /100 | #326 | Tragic 15.2% |
| Crow | 0.0 /100 | #327 | Tragic 15.2% |
| Sioux | 0.0 /100 | #328 | Tragic 15.3% |
| Immigrants | Dominica | 0.0 /100 | #329 | Tragic 15.5% |
| Immigrants | St. Vincent and the Grenadines | 0.0 /100 | #330 | Tragic 15.5% |
| British West Indians | 0.0 /100 | #331 | Tragic 15.6% |
| Immigrants | Grenada | 0.0 /100 | #332 | Tragic 15.8% |
| Immigrants | Yemen | 0.0 /100 | #333 | Tragic 15.9% |
| Immigrants | Nicaragua | 0.0 /100 | #334 | Tragic 15.9% |
| Cubans | 0.0 /100 | #335 | Tragic 16.1% |
Demographics Similar to Hawaiians by Seniors Poverty Over the Age of 65
In terms of seniors poverty over the age of 65, the demographic groups most similar to Hawaiians are Immigrants from Croatia (10.3%, a difference of 0.010%), Syrian (10.3%, a difference of 0.030%), Kenyan (10.3%, a difference of 0.070%), Aleut (10.3%, a difference of 0.090%), and South African (10.3%, a difference of 0.16%).
| Demographics | Rating | Rank | Seniors Poverty Over the Age of 65 |
| Marshallese | 95.3 /100 | #100 | Exceptional 10.2% |
| Immigrants | Jordan | 94.7 /100 | #101 | Exceptional 10.2% |
| Delaware | 94.5 /100 | #102 | Exceptional 10.2% |
| Icelanders | 94.4 /100 | #103 | Exceptional 10.3% |
| South Africans | 94.3 /100 | #104 | Exceptional 10.3% |
| Aleuts | 94.1 /100 | #105 | Exceptional 10.3% |
| Kenyans | 94.1 /100 | #106 | Exceptional 10.3% |
| Hawaiians | 93.9 /100 | #107 | Exceptional 10.3% |
| Immigrants | Croatia | 93.9 /100 | #108 | Exceptional 10.3% |
| Syrians | 93.8 /100 | #109 | Exceptional 10.3% |
| Immigrants | Zimbabwe | 93.5 /100 | #110 | Exceptional 10.3% |
| Immigrants | Belgium | 93.4 /100 | #111 | Exceptional 10.3% |
| Immigrants | Korea | 93.3 /100 | #112 | Exceptional 10.3% |
| Immigrants | Romania | 93.3 /100 | #113 | Exceptional 10.3% |
| Immigrants | Denmark | 92.7 /100 | #114 | Exceptional 10.3% |