Immigrants from Austria vs Immigrants from Australia Seniors Poverty Over the Age of 65
COMPARE
Immigrants from Austria
Immigrants from Australia
Seniors Poverty Over the Age of 65
Seniors Poverty Over the Age of 65 Comparison
Immigrants from Austria
Immigrants from Australia
9.9%
SENIORS POVERTY OVER THE AGE OF 65
98.6/ 100
METRIC RATING
67th/ 347
METRIC RANK
10.5%
SENIORS POVERTY OVER THE AGE OF 65
85.1/ 100
METRIC RATING
137th/ 347
METRIC RANK
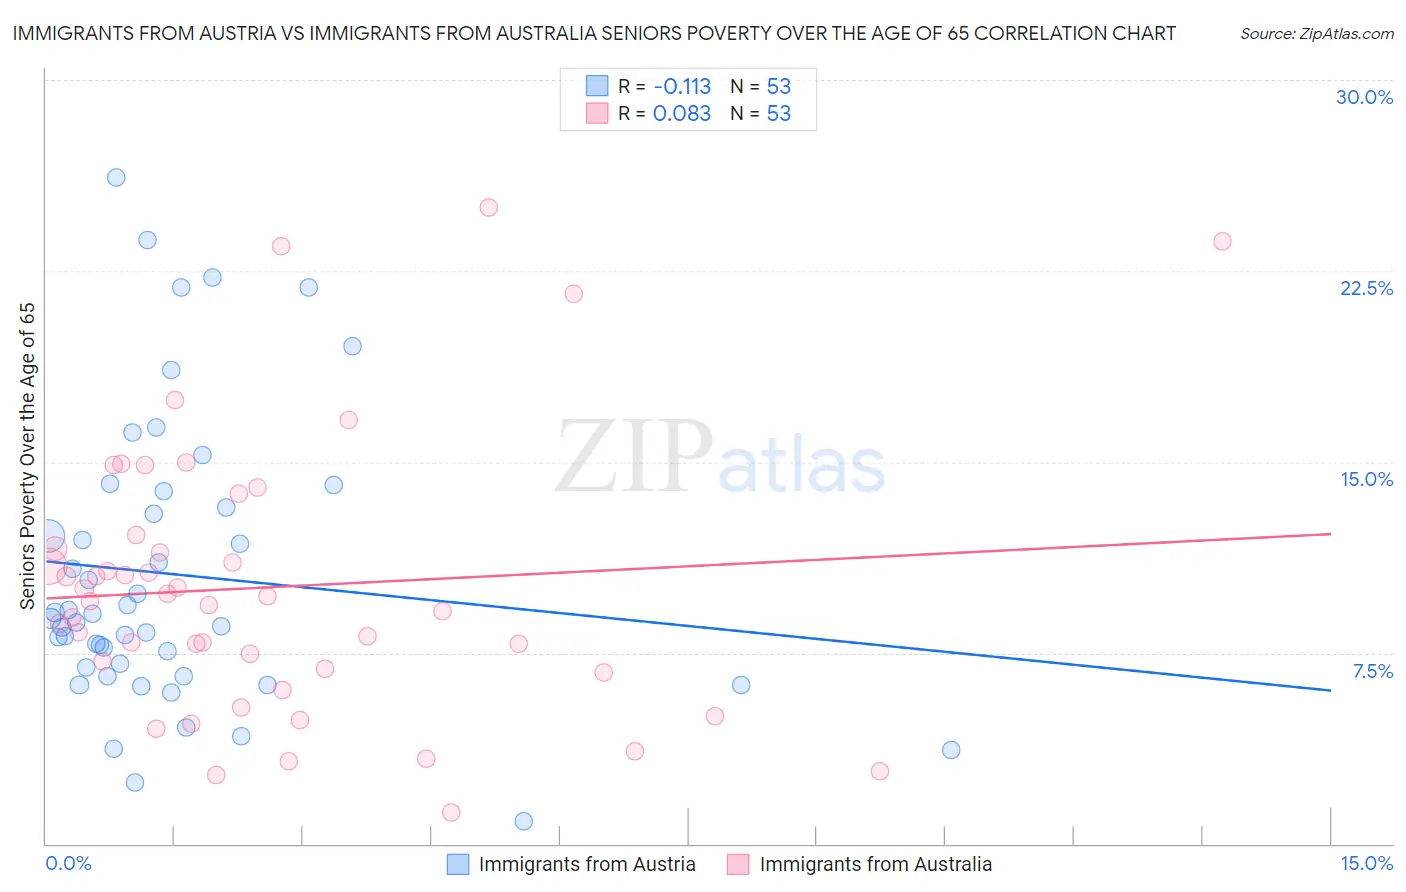
Immigrants from Austria vs Immigrants from Australia Seniors Poverty Over the Age of 65 Correlation Chart
The statistical analysis conducted on geographies consisting of 167,803,456 people shows a poor negative correlation between the proportion of Immigrants from Austria and poverty level among seniors over the age of 65 in the United States with a correlation coefficient (R) of -0.113 and weighted average of 9.9%. Similarly, the statistical analysis conducted on geographies consisting of 226,798,964 people shows a slight positive correlation between the proportion of Immigrants from Australia and poverty level among seniors over the age of 65 in the United States with a correlation coefficient (R) of 0.083 and weighted average of 10.5%, a difference of 6.2%.
Seniors Poverty Over the Age of 65 Correlation Summary
| Measurement | Immigrants from Austria | Immigrants from Australia |
| Minimum | 0.86% | 1.2% |
| Maximum | 26.2% | 25.0% |
| Range | 25.3% | 23.8% |
| Mean | 10.6% | 10.1% |
| Median | 8.9% | 9.5% |
| Interquartile 25% (IQ1) | 6.7% | 6.8% |
| Interquartile 75% (IQ3) | 13.5% | 11.9% |
| Interquartile Range (IQR) | 6.8% | 5.0% |
| Standard Deviation (Sample) | 5.6% | 5.4% |
| Standard Deviation (Population) | 5.6% | 5.3% |
Similar Demographics by Seniors Poverty Over the Age of 65
Demographics Similar to Immigrants from Austria by Seniors Poverty Over the Age of 65
In terms of seniors poverty over the age of 65, the demographic groups most similar to Immigrants from Austria are Immigrants from Netherlands (9.9%, a difference of 0.10%), Pennsylvania German (9.9%, a difference of 0.15%), Canadian (9.9%, a difference of 0.22%), Australian (9.9%, a difference of 0.37%), and Immigrants from North America (9.9%, a difference of 0.44%).
| Demographics | Rating | Rank | Seniors Poverty Over the Age of 65 |
| Celtics | 99.0 /100 | #60 | Exceptional 9.8% |
| Iranians | 98.9 /100 | #61 | Exceptional 9.8% |
| French Canadians | 98.9 /100 | #62 | Exceptional 9.8% |
| Macedonians | 98.8 /100 | #63 | Exceptional 9.9% |
| Immigrants | North America | 98.8 /100 | #64 | Exceptional 9.9% |
| Pennsylvania Germans | 98.7 /100 | #65 | Exceptional 9.9% |
| Immigrants | Netherlands | 98.7 /100 | #66 | Exceptional 9.9% |
| Immigrants | Austria | 98.6 /100 | #67 | Exceptional 9.9% |
| Canadians | 98.5 /100 | #68 | Exceptional 9.9% |
| Australians | 98.4 /100 | #69 | Exceptional 9.9% |
| Samoans | 98.0 /100 | #70 | Exceptional 10.0% |
| Yugoslavians | 97.9 /100 | #71 | Exceptional 10.0% |
| Palestinians | 97.9 /100 | #72 | Exceptional 10.0% |
| Russians | 97.9 /100 | #73 | Exceptional 10.0% |
| Turks | 97.9 /100 | #74 | Exceptional 10.0% |
Demographics Similar to Immigrants from Australia by Seniors Poverty Over the Age of 65
In terms of seniors poverty over the age of 65, the demographic groups most similar to Immigrants from Australia are Immigrants from Latvia (10.5%, a difference of 0.060%), Portuguese (10.5%, a difference of 0.16%), Immigrants from Serbia (10.5%, a difference of 0.26%), Immigrants from Norway (10.5%, a difference of 0.27%), and Immigrants from Kenya (10.5%, a difference of 0.29%).
| Demographics | Rating | Rank | Seniors Poverty Over the Age of 65 |
| Immigrants | Oceania | 88.4 /100 | #130 | Excellent 10.4% |
| Egyptians | 87.8 /100 | #131 | Excellent 10.5% |
| Immigrants | Turkey | 87.7 /100 | #132 | Excellent 10.5% |
| Guamanians/Chamorros | 87.5 /100 | #133 | Excellent 10.5% |
| Sierra Leoneans | 86.8 /100 | #134 | Excellent 10.5% |
| Immigrants | Norway | 86.5 /100 | #135 | Excellent 10.5% |
| Immigrants | Serbia | 86.4 /100 | #136 | Excellent 10.5% |
| Immigrants | Australia | 85.1 /100 | #137 | Excellent 10.5% |
| Immigrants | Latvia | 84.7 /100 | #138 | Excellent 10.5% |
| Portuguese | 84.1 /100 | #139 | Excellent 10.5% |
| Immigrants | Kenya | 83.4 /100 | #140 | Excellent 10.5% |
| Immigrants | Europe | 83.3 /100 | #141 | Excellent 10.5% |
| Osage | 82.8 /100 | #142 | Excellent 10.6% |
| Immigrants | Asia | 80.8 /100 | #143 | Excellent 10.6% |
| Iraqis | 80.7 /100 | #144 | Excellent 10.6% |