Shoshone vs Immigrants from Portugal Female Poverty Among 25-34 Year Olds
COMPARE
Shoshone
Immigrants from Portugal
Female Poverty Among 25-34 Year Olds
Female Poverty Among 25-34 Year Olds Comparison
Shoshone
Immigrants from Portugal
16.2%
FEMALE POVERTY AMONG 25-34 YEAR OLDS
0.0/ 100
METRIC RATING
284th/ 347
METRIC RANK
14.4%
FEMALE POVERTY AMONG 25-34 YEAR OLDS
4.3/ 100
METRIC RATING
222nd/ 347
METRIC RANK
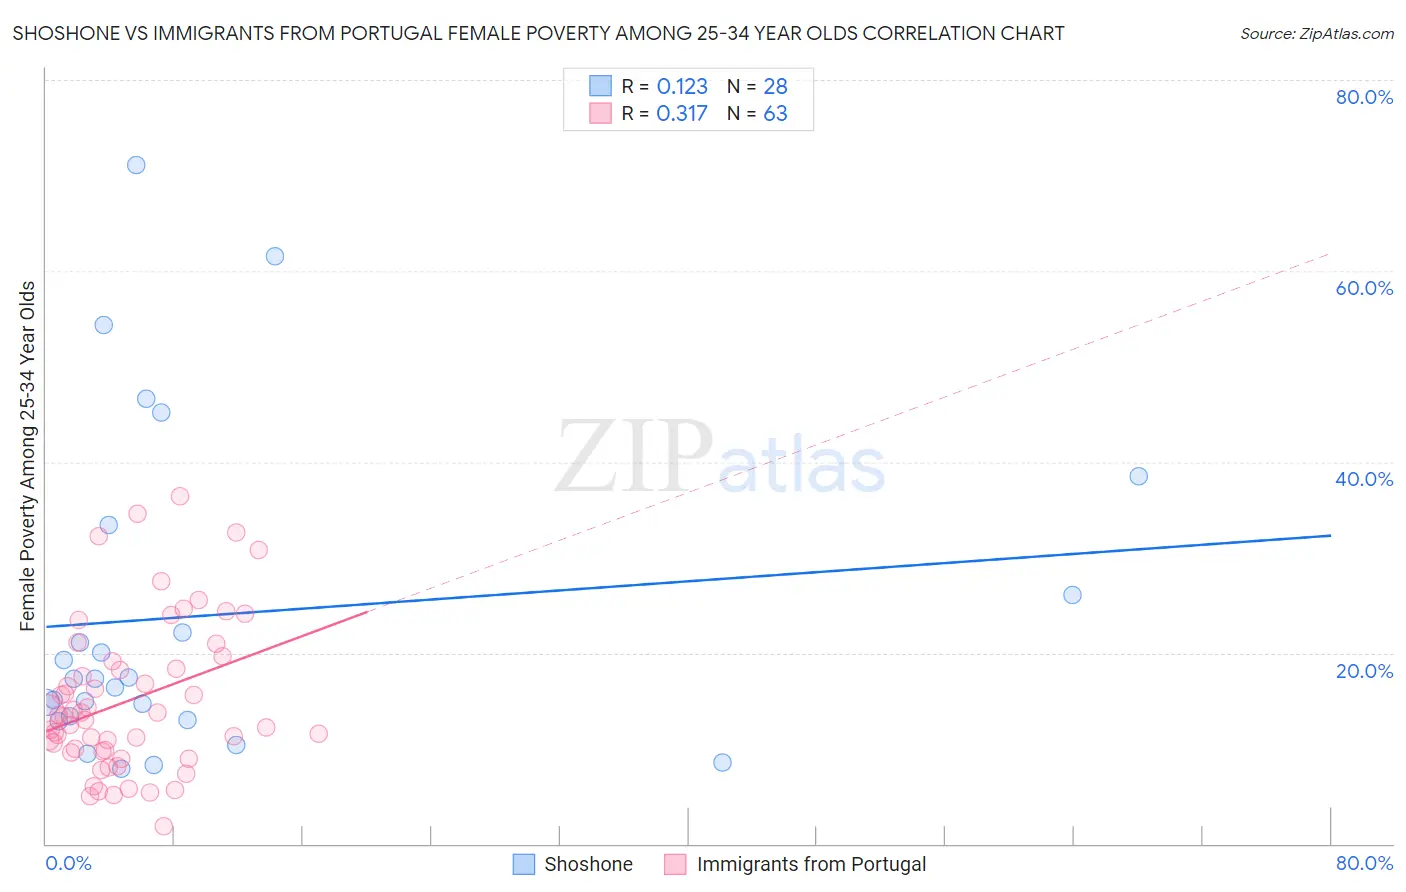
Shoshone vs Immigrants from Portugal Female Poverty Among 25-34 Year Olds Correlation Chart
The statistical analysis conducted on geographies consisting of 66,384,090 people shows a poor positive correlation between the proportion of Shoshone and poverty level among females between the ages 25 and 34 in the United States with a correlation coefficient (R) of 0.123 and weighted average of 16.2%. Similarly, the statistical analysis conducted on geographies consisting of 172,676,912 people shows a mild positive correlation between the proportion of Immigrants from Portugal and poverty level among females between the ages 25 and 34 in the United States with a correlation coefficient (R) of 0.317 and weighted average of 14.4%, a difference of 12.7%.
Female Poverty Among 25-34 Year Olds Correlation Summary
| Measurement | Shoshone | Immigrants from Portugal |
| Minimum | 7.9% | 1.8% |
| Maximum | 71.1% | 36.4% |
| Range | 63.3% | 34.6% |
| Mean | 24.0% | 15.0% |
| Median | 17.3% | 13.3% |
| Interquartile 25% (IQ1) | 13.1% | 9.7% |
| Interquartile 75% (IQ3) | 29.7% | 19.1% |
| Interquartile Range (IQR) | 16.6% | 9.5% |
| Standard Deviation (Sample) | 17.1% | 7.9% |
| Standard Deviation (Population) | 16.8% | 7.9% |
Similar Demographics by Female Poverty Among 25-34 Year Olds
Demographics Similar to Shoshone by Female Poverty Among 25-34 Year Olds
In terms of female poverty among 25-34 year olds, the demographic groups most similar to Shoshone are Immigrants from Bahamas (16.3%, a difference of 0.50%), Cape Verdean (16.3%, a difference of 0.68%), American (16.4%, a difference of 0.73%), Bahamian (16.1%, a difference of 0.83%), and Aleut (16.1%, a difference of 0.87%).
| Demographics | Rating | Rank | Female Poverty Among 25-34 Year Olds |
| Immigrants | Micronesia | 0.0 /100 | #277 | Tragic 15.8% |
| French American Indians | 0.0 /100 | #278 | Tragic 15.9% |
| Fijians | 0.0 /100 | #279 | Tragic 15.9% |
| Bangladeshis | 0.0 /100 | #280 | Tragic 15.9% |
| Immigrants | Latin America | 0.0 /100 | #281 | Tragic 16.0% |
| Aleuts | 0.0 /100 | #282 | Tragic 16.1% |
| Bahamians | 0.0 /100 | #283 | Tragic 16.1% |
| Shoshone | 0.0 /100 | #284 | Tragic 16.2% |
| Immigrants | Bahamas | 0.0 /100 | #285 | Tragic 16.3% |
| Cape Verdeans | 0.0 /100 | #286 | Tragic 16.3% |
| Americans | 0.0 /100 | #287 | Tragic 16.4% |
| Guatemalans | 0.0 /100 | #288 | Tragic 16.4% |
| Osage | 0.0 /100 | #289 | Tragic 16.4% |
| Indonesians | 0.0 /100 | #290 | Tragic 16.4% |
| Comanche | 0.0 /100 | #291 | Tragic 16.5% |
Demographics Similar to Immigrants from Portugal by Female Poverty Among 25-34 Year Olds
In terms of female poverty among 25-34 year olds, the demographic groups most similar to Immigrants from Portugal are Nigerian (14.4%, a difference of 0.060%), Sudanese (14.4%, a difference of 0.070%), Immigrants from Sudan (14.4%, a difference of 0.13%), Ghanaian (14.4%, a difference of 0.22%), and Immigrants from Thailand (14.3%, a difference of 0.39%).
| Demographics | Rating | Rank | Female Poverty Among 25-34 Year Olds |
| Immigrants | Nigeria | 6.2 /100 | #215 | Tragic 14.3% |
| French Canadians | 5.5 /100 | #216 | Tragic 14.3% |
| Spanish American Indians | 5.5 /100 | #217 | Tragic 14.3% |
| Immigrants | Thailand | 5.2 /100 | #218 | Tragic 14.3% |
| Ecuadorians | 5.2 /100 | #219 | Tragic 14.3% |
| Ghanaians | 4.8 /100 | #220 | Tragic 14.4% |
| Sudanese | 4.4 /100 | #221 | Tragic 14.4% |
| Immigrants | Portugal | 4.3 /100 | #222 | Tragic 14.4% |
| Nigerians | 4.2 /100 | #223 | Tragic 14.4% |
| Immigrants | Sudan | 4.0 /100 | #224 | Tragic 14.4% |
| Immigrants | Barbados | 3.4 /100 | #225 | Tragic 14.5% |
| Nicaraguans | 3.3 /100 | #226 | Tragic 14.5% |
| Celtics | 2.8 /100 | #227 | Tragic 14.5% |
| Vietnamese | 2.6 /100 | #228 | Tragic 14.6% |
| Spanish | 2.5 /100 | #229 | Tragic 14.6% |