Shoshone vs Immigrants from Central America Female Poverty Among 25-34 Year Olds
COMPARE
Shoshone
Immigrants from Central America
Female Poverty Among 25-34 Year Olds
Female Poverty Among 25-34 Year Olds Comparison
Shoshone
Immigrants from Central America
16.2%
FEMALE POVERTY AMONG 25-34 YEAR OLDS
0.0/ 100
METRIC RATING
284th/ 347
METRIC RANK
16.6%
FEMALE POVERTY AMONG 25-34 YEAR OLDS
0.0/ 100
METRIC RATING
294th/ 347
METRIC RANK
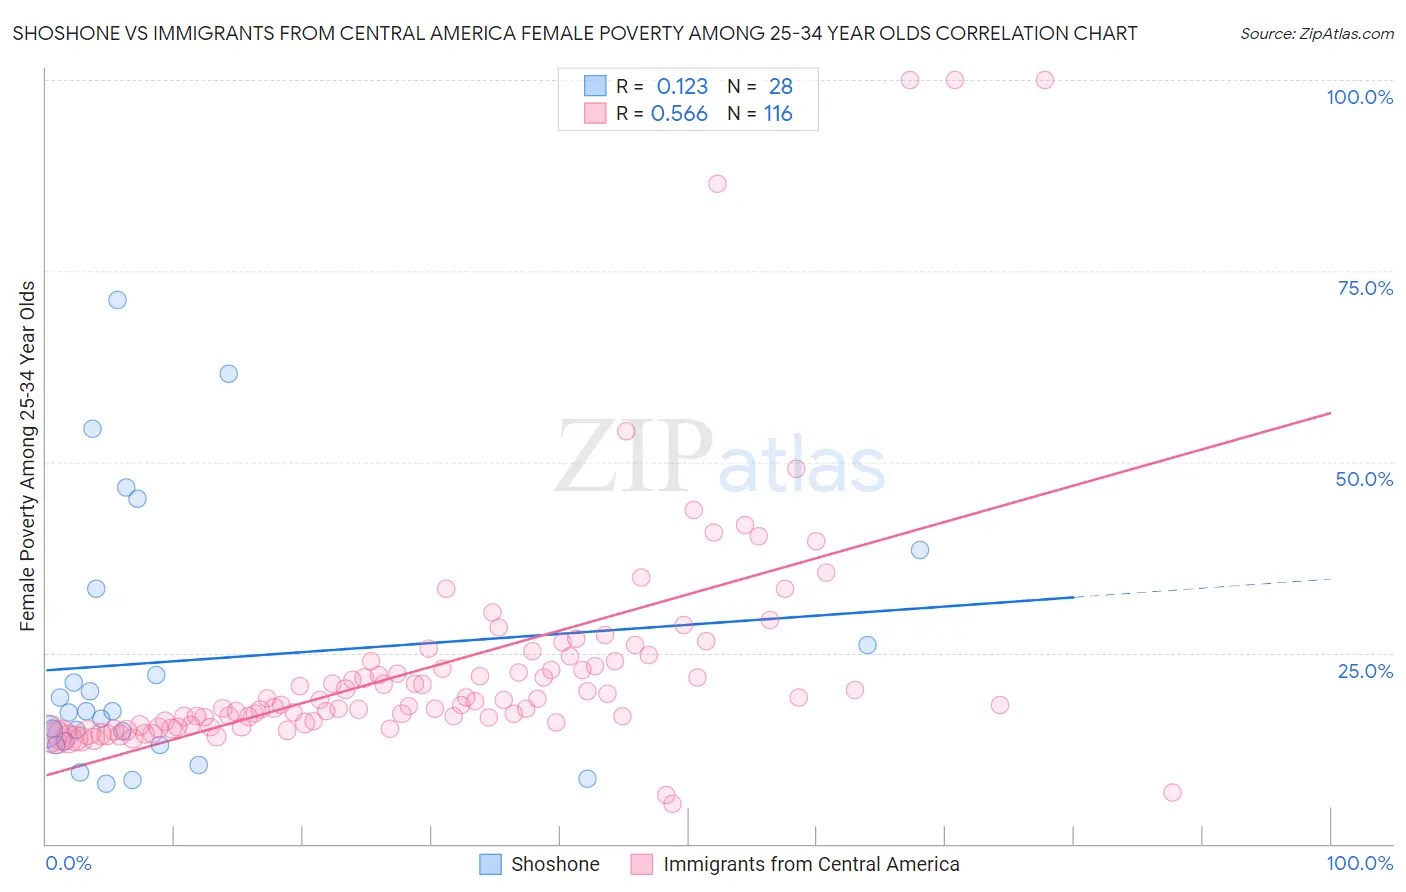
Shoshone vs Immigrants from Central America Female Poverty Among 25-34 Year Olds Correlation Chart
The statistical analysis conducted on geographies consisting of 66,384,090 people shows a poor positive correlation between the proportion of Shoshone and poverty level among females between the ages 25 and 34 in the United States with a correlation coefficient (R) of 0.123 and weighted average of 16.2%. Similarly, the statistical analysis conducted on geographies consisting of 522,040,118 people shows a substantial positive correlation between the proportion of Immigrants from Central America and poverty level among females between the ages 25 and 34 in the United States with a correlation coefficient (R) of 0.566 and weighted average of 16.6%, a difference of 2.1%.
Female Poverty Among 25-34 Year Olds Correlation Summary
| Measurement | Shoshone | Immigrants from Central America |
| Minimum | 7.9% | 5.3% |
| Maximum | 71.1% | 100.0% |
| Range | 63.3% | 94.7% |
| Mean | 24.0% | 23.3% |
| Median | 17.3% | 18.5% |
| Interquartile 25% (IQ1) | 13.1% | 15.6% |
| Interquartile 75% (IQ3) | 29.7% | 23.9% |
| Interquartile Range (IQR) | 16.6% | 8.2% |
| Standard Deviation (Sample) | 17.1% | 16.1% |
| Standard Deviation (Population) | 16.8% | 16.0% |
Demographics Similar to Shoshone and Immigrants from Central America by Female Poverty Among 25-34 Year Olds
In terms of female poverty among 25-34 year olds, the demographic groups most similar to Shoshone are Immigrants from Bahamas (16.3%, a difference of 0.50%), Cape Verdean (16.3%, a difference of 0.68%), American (16.4%, a difference of 0.73%), Bahamian (16.1%, a difference of 0.83%), and Aleut (16.1%, a difference of 0.87%). Similarly, the demographic groups most similar to Immigrants from Central America are Mexican (16.6%, a difference of 0.080%), Hispanic or Latino (16.6%, a difference of 0.27%), Immigrants from Guatemala (16.6%, a difference of 0.33%), Potawatomi (16.5%, a difference of 0.36%), and Immigrants from Dominica (16.5%, a difference of 0.63%).
| Demographics | Rating | Rank | Female Poverty Among 25-34 Year Olds |
| Fijians | 0.0 /100 | #279 | Tragic 15.9% |
| Bangladeshis | 0.0 /100 | #280 | Tragic 15.9% |
| Immigrants | Latin America | 0.0 /100 | #281 | Tragic 16.0% |
| Aleuts | 0.0 /100 | #282 | Tragic 16.1% |
| Bahamians | 0.0 /100 | #283 | Tragic 16.1% |
| Shoshone | 0.0 /100 | #284 | Tragic 16.2% |
| Immigrants | Bahamas | 0.0 /100 | #285 | Tragic 16.3% |
| Cape Verdeans | 0.0 /100 | #286 | Tragic 16.3% |
| Americans | 0.0 /100 | #287 | Tragic 16.4% |
| Guatemalans | 0.0 /100 | #288 | Tragic 16.4% |
| Osage | 0.0 /100 | #289 | Tragic 16.4% |
| Indonesians | 0.0 /100 | #290 | Tragic 16.4% |
| Comanche | 0.0 /100 | #291 | Tragic 16.5% |
| Immigrants | Dominica | 0.0 /100 | #292 | Tragic 16.5% |
| Potawatomi | 0.0 /100 | #293 | Tragic 16.5% |
| Immigrants | Central America | 0.0 /100 | #294 | Tragic 16.6% |
| Mexicans | 0.0 /100 | #295 | Tragic 16.6% |
| Hispanics or Latinos | 0.0 /100 | #296 | Tragic 16.6% |
| Immigrants | Guatemala | 0.0 /100 | #297 | Tragic 16.6% |
| Blackfeet | 0.0 /100 | #298 | Tragic 16.7% |
| Spanish Americans | 0.0 /100 | #299 | Tragic 16.7% |